Statistical release: BIS international banking statistics and global liquidity indicators at end-June 2024

Key takeaways
- Global cross-border bank claims changed little during the second quarter of 2024. Claims dropped by a modest $11 billion following a surge in the previous quarter.
- Cross-border bank credit (ie loans and holdings of debt securities) rose by a mere $36 billion during Q2, leaving the year-on-year (yoy) growth rate at 6%. Credit to advanced economies (AEs) grew at 6% yoy, while that to emerging market and developing economies (EMDEs) accelerated to 3% yoy.
- Dollar-denominated credit to EMDEs continued to contract. By contrast, credit denominated in the Chinese renminbi rose further, mainly to borrowers in the Asia-Pacific region.
- The BIS global liquidity indicators (GLIs) show that dollar-denominated foreign currency credit to non-banks in EMDEs fell modestly during Q2 2024. Bank lending declined slightly while international bond issuance held up.
Global cross-border bank credit shows little change
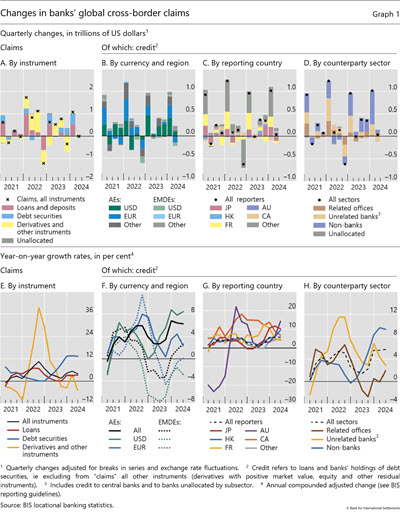
The BIS locational banking statistics (LBS) reveal that banks global cross-border claims dropped slightly in the second quarter of 2024, by $11 billion on an exchange rate and break-adjusted basis (Graph 1.A).1 This left the outstanding stock at $39.2 trillion, 4% higher than a year earlier (Graph 1.E).
Bank credit ie loans and holdings of debt securities, excluding derivatives and other instruments rose by $36 billion (Graph 1.C), leaving the yoy growth rate at 6%, as in the previous quarter (Graph 1.G). The modest increase mainly reflected greater credit to non-banks, although greater inter-office positions contributed somewhat (Graphs 1.D and 1.H). Among AEs, credit to the euro area and Japan fell by $88 billion and $57 billion, respectively, while credit to the Cayman Islands and the United States rose. At the same time, credit to EMDEs expanded by $23 billion during the quarter.
Credit to non-banks continues to rise
The uptick in global cross-border credit during Q2 mainly reflected lending to non-bank borrowers, extending a trend observed in recent quarters (Graph 1.D). The annual growth rate stood at 9%, a pace not seen since early 2020 (Graph 1.H).
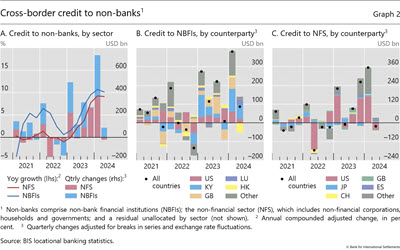
The Q2 increase went to non-bank financial institutions (NBFIs), rather than to the non-financial sector (Graph 2.A). As a result, the yoy growth in credit to NBFIs remained at 10%, with the bulk extended to borrowers in the Cayman Islands and Luxembourg and, to a lesser extent, the United States (Graph 2.B). Credit to the non-financial sector, by contrast, fell by $21 billion, mainly vis- -vis borrowers in the United States (Graph 2.C). Banks in Japan recorded a drop of around $110 billion, only partially offset by more credit from banks in France, the United Kingdom and Canada.2
Rising renminbi credit within emerging Asia-Pacific
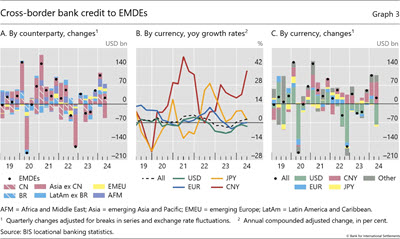
Cross-border bank credit to EMDEs rose for the third consecutive quarter, by $23 billion (Graph 3.A). This pushed the growth rate to 3% yoy, up from 2% the quarter before (Graph 3.B, dashed line). Banks located in Hong Kong SAR, the United Kingdom and Macao SAR reported the largest increases in Q2, mainly in credit denominated in the Chinese renminbi (CNY).
Across EMDE regions, credit developments in Q2 were shaped by the major economies within each region (Graph 3.A). Credit to China increased by $39 billion, while that to the rest of Asia-Pacific fell overall. Likewise, in Latin America and the Caribbean, credit to Brazil rose by $9 billion while the rest of the region saw little change. Credit to emerging Europe increased by $11 billion, about half of which went to Turkey. Credit to Africa and the Middle East rose by $18 billion, mainly to borrowers in Qatar and Saudi Arabia.
Credit to EMDEs diverged across currencies, with the decline in dollar credit offset by credit in renminbi, mainly to borrowers in the Asia-Pacific region. Credit denominated in US dollars has trended downwards since early 2022, coinciding with the start of the Federal Reserve s tightening cycle (Graph 3.C), and fell further in Q2 ( $78 billion).3 The cumulative decline in dollar credit to EMDEs over this period has reached more than $380 billion, mainly affecting borrowers in Asia-Pacific. Dollar credit to China has declined by $80 billion since early 2022, while it dropped by a combined $200 billion vis- -vis Hong Kong and Macao. By contrast, renminbi-denominated cross-border credit to EMDEs grew for the ninth consecutive quarter, representing a cumulative increase of nearly $240 billion since early 2022 (Graph 3.C).4
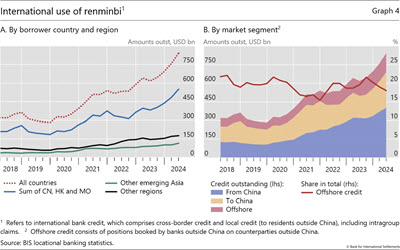
This rise in cross-border renminbi credit has been behind the overall increase in international renminbi credit, which includes both global cross-border credit plus locally extended credit to borrowers outside China. Much of this has been directed at borrowers in emerging Asia-Pacific (Graph 4.A). Cross-border renminbi credit to borrowers in China, and international renminbi credit to those in Hong Kong and Macao combined, reached $550 billion in Q2 2024 (blue line). International credit to other borrowers in the region, eg in Korea, Malaysia and Singapore, has also been on the rise, though from a lower base (green line). International credit to borrowers outside the region, mainly in the United Kingdom, Cayman Islands and Australia, accounted for a small share of the total (black line).
The international use of renminbi to date remains largely centred on China. Banks located in China account for the largest part of cross-border credit denominated in renminbi (Graph 4.B, purple area). Much of the remaining renminbi credit is extended by banks outside China to borrowers located in China (tan area). These outward and inward positions with China thus account for the bulk of total credit. Renminbi use in offshore transactions (red area), ie for credit between banks and borrowers both located outside of China, remains limited, and has registered a smaller increase (+$60 billion).5
Global liquidity indicators at end-June 2024
The BIS global liquidity indicators (GLIs) track total credit to non-bank borrowers, covering both loans extended by banks and funding from international bond markets.6 The latter is captured through the net issuance (gross issuance less redemptions) of international debt securities (IDS). The focus is on foreign currency credit denominated in the three major reserve currencies (US dollar, euro and Japanese yen) to non-residents, ie borrowers outside the respective currency areas.
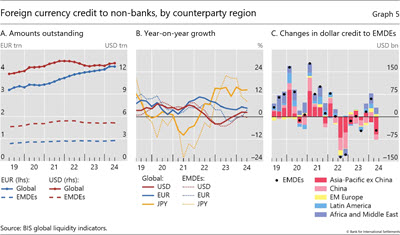
Global foreign currency credit denominated in US dollars and yen saw modest increases, while those in euros fell slightly in Q2 2024. The $87 billion rise in dollar credit to non-banks outside the United States left the outstanding stock at $13 trillion (Graph 5.A, solid red line). The growth rate remained at 2% year-on-year (yoy) (Graph 5.B, red line). Yen credit to non-banks outside Japan also expanded modestly in Q2; the outstanding amount surpassed 64 trillion ($400 billion), up 14% from a year earlier (Graph 5.B, solid yellow line). Euro credit to non-banks outside the euro area rose fell slightly by around 200 million, to 4.2 trillion ($4.5 trillion), but still up 5% from a year earlier (Graph 5, blue lines).
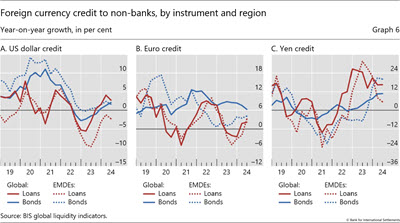
In contrast to the global total, dollar credit to emerging market and developing economies (EMDEs) declined by $45 billion, to $5.1 trillion (Graph 5.A). The drop in dollar credit was more pronounced for borrowers in emerging Asia-Pacific economies, amounting to $76 billion (Graph 5.C). Increases in dollar credit to other EMDE regions did not fully offset this decline. This resulted in almost zero yoy growth in dollar credit to EMDEs overall (Graph 5.B, dotted red line). Another notable feature of dollar credit to EMDEs has been the weakness in the bank lending component (rather than bond financing), extending a trend observed since before the pandemic. Since end-2018, growth in dollar-denominated bank lending (Graph 6.A, dotted red line) has consistently fallen short of growth in bond financing (dotted blue line), by an average of 7 percentage points.
The disparity in growth between bank lending and bond financing to EMDE borrowers observed in dollar credit also stood out in the euro segment, but not in the yen segment. Since end-2018, growth in euro bank lending has been 3 percentage points below that in bond financing on average, despite signs of recovery in loan growth in the most recent period (Graph 6.B). For the yen, low interest rates and yen depreciation through mid-2024 went hand in hand with a surge in bank lending since mid-2022, although growth has slowed in 2024 (Graph 6.C).
1 In the BIS LBS, bank claims comprise: (i) loans and deposits; (ii) holdings of debt securities; and (iii) derivatives with a positive market value and other residual instruments (combined). Credit is defined as the sum of (i) and (ii).
2 Data for Japan relate to claims in all instruments, ie credit and other instruments including derivatives.
3 During Q2 2024, the federal funds rate exceeded 5% and the dollar appreciated by 2.6% as measured by the nominal broad US dollar index.
4 In addition to China, 14 other economies, including Hong Kong, Macao, Korea and Australia, report renminbi-denominated claims.
5 For a fuller discussion of the currency dimension in international statistics, see P McGuire, G von Peter and S Zhu, International finance through the lens of BIS statistics: the global reach of currencies , BIS Quarterly Review, June 2024.
6 The GLIs cover total foreign currency credit denominated in US dollars, euros or Japanese yen, which includes loans from banks plus outstanding international bonds. This is broader than "bank credit" covered in previous sections, which captures banks' loans and their holdings of debt securities.

