International finance through the lens of BIS statistics: the global reach of currencies

The use of key currencies in international finance far outstrips the issuing jurisdictions' share in global economic activity. The US dollar dominates globally, while the euro, yen and pound sterling have a smaller international footprint. The reach of key currencies becomes apparent only in statistics with a currency dimension. The BIS statistics on international banking, bonds and derivatives markets have had a currency dimension since their inception. This dimension is essential for assessing exposure to currency risk, squeezes in funding markets and vulnerabilities associated with foreign exchange markets. 1
JEL classification: F23, F31, F36, G15.
Countries can rise or fall on the soundness of their currencies. Monetary, fiscal and other policy decisions that affect the value of major international currencies – like the US dollar or the euro – have implications far beyond the currency-issuing jurisdiction. Firms and households outside these jurisdictions must navigate global forces transmitted via currencies in the financial realms in which they operate. Foreign currency borrowing has, in one way or another, been a flashpoint in every major postwar crisis. When key currencies move, or when their funding markets seize up, no country is left untouched. Tracking the use of currencies in international markets is critical in financial stability analysis.
What makes a currency "international", and how can its use across the array of markets in international finance be understood? Or, to put it another way, why are some currencies more international than others? A fundamental aspect is the invoicing of trade. It is not unreasonable to suppose that a currency's share in the international domain reflects the size of the currency-issuing economy and its share in international trade. At the extreme, the view that the perimeters of currency use and balance sheets align with the economic border is known as the "triple coincidence" (Avdjiev et al (2016)) – an analytical simplification often used in international economics. In reality, some currencies – the US dollar in particular – are used much more widely than that for reasons that are mostly financial.
Key takeaways
- BIS statistics have a currency dimension, enabling users to track how key currencies are used in international banking and bond markets, and in foreign exchange and derivatives markets.
- The dollar plays an outsize role in international finance mainly because of its use offshore, as a unit of account and medium of exchange among counterparties outside the United States.
- The currency dimension in international statistics provides insights about countries' external debt, banks' foreign currency funding needs and payment obligations from FX derivatives.
This feature is a primer on how BIS statistics can be used to understand the role of currencies in international finance. The currency dimension has a long history in BIS statistics. The expansion of international banking in the late 1950s led to concerns that offshore activity could undermine control of monetary aggregates. This spurred the collection in the 1960s of the BIS locational banking statistics (LBS), which capture banks' international positions by currency. To track currency use beyond banking, the BIS later compiled data on bonds, foreign exchange (FX) and derivatives markets. Some statistical collections at other international organisations, eg the International Monetary Fund (IMF), and some vendor data sets also feature a currency dimension.
Taken together, these statistics highlight the pervasive use of key currencies – notably the US dollar – in the global financial system. In international banking, for example, the US dollar dominates because of its use in offshore transactions, ie transactions between parties that both reside outside the currency area. In international bond markets, dollar-denominated bonds account for the bulk of amounts outstanding. And in foreign exchange markets, the dollar is the vehicle currency of choice. As a result, off-balance sheet dollar payment obligations build up, much of them outside the United States, creating potential vulnerabilities. Other currencies – eg the euro, Japanese yen and British pound – have a regional role but a smaller international footprint.
Key currencies shape the pattern of global capital flows, and policy decisions taken in the currency-issuing countries spill over to the rest of the world. The growth in foreign currency credit is sensitive to changes in interest rates and exchange rates, which expose borrowers, especially in emerging market economies (EMEs), to global factors. When countries borrow heavily in a foreign currency, their debt burdens rise when that currency appreciates – a mechanism at the heart of many crises.
Recognising the international role of key currencies is crucial for understanding many policy-relevant issues. Some are macroeconomic in nature. For example, trade invoicing practices affect how exchange rate developments pass-through to inflation and economic activity. Whether depreciations are expansionary further depends on the currency composition of a country's external positions. Many issues also relate to international finance, a domain in which BIS statistics shed much light. This feature illustrates the usefulness of the currency dimension through three examples: foreign currency debt in financial crises, the geography of banks' foreign currency liabilities and the hidden dollar debt arising from FX derivatives.
The rest of this feature is organised as follows. The first section documents the role of currencies in international finance through the lens of BIS statistics. The second examines the implications for several policy-relevant issues. A box lays out the currency dimension in official international statistics. The final section concludes.
Currencies in international finance
Currency denomination is an intrinsic attribute of contracts and financial instruments that facilitate the exchange of goods, services and capital. Goods and services are generally priced in the domestic currency and agents assess their cash flows in that currency.2 Loans and bonds used for extending credit are promises to pay back principal plus interest in a specified currency, usually the domestic currency. Most economic units in an economy therefore take domestic money as their reference currency. International trade, on the other hand, is often invoiced and settled in a major currency, most notably the US dollar (Boz et al (2022)).
The use of a currency in the international domain can be defined with respect to a currency-issuing area. International activity for any given currency consists of transactions or positions involving a non-resident of the currency area. It excludes those conducted in the domestic currency within a currency area, eg euro loans from France to Spain. The international domain thus comprises three segments: activity between non-residents and residents of the currency area (both inward and outward), and offshore activity between non-residents of the currency area.
Why are some currencies widely used in the international domain? Factors cited in the literature include (i) the weight of the issuing country in global trade and finance; (ii) the availability of safe assets denominated in the currency, with deep and liquid markets; (iii) stability based on sound fiscal and monetary policies; and (iv) exchange rate flexibility and a convertible capital account to accommodate capital flows.3 Currencies that score high on these factors tend to have liquid government bond markets that serve as a basis for pricing other assets in that currency. Network effects in the adoption and use of a currency in trade and finance then tend to reinforce each other (eg Rey (2001), Gopinath and Stein (2021)).
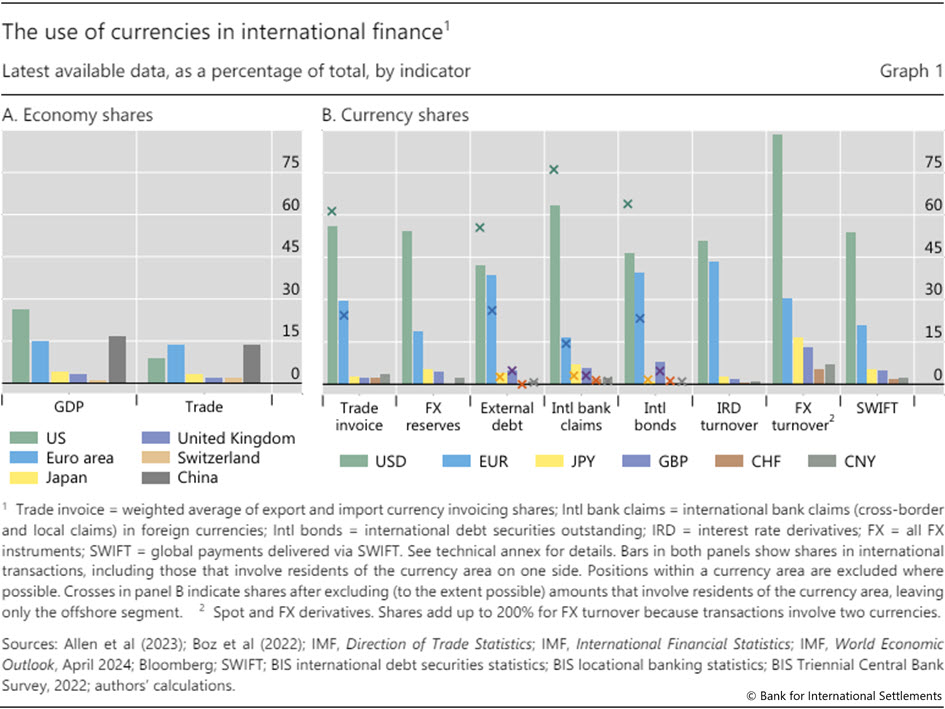
Several major currencies fulfil these conditions, yet one currency – the US dollar – has been dominant in the post-World War II era. Graph 1.B presents currency shares in international activity (bars) and offshore activity (crosses) across several markets.4 While the euro, yen and other currencies do play an international role, the US dollar occupies the top position in all markets (Graph 1.B, green bars). Trade invoicing in dollars begets dollar debt that needs to be financed. The depth of dollar capital markets creates thick market externalities that attract both investors and issuers.
Focusing on offshore activity puts the dominance of the dollar into even sharper relief (Graph 1.B, green crosses). The shares of the dollar in each market shown, and of the euro in all but one market, outstrip the issuing jurisdiction's share in global gross domestic product (GDP) (Graph 1.A). By contrast, the shares of the British pound, Japanese yen and Swiss franc exceed in only some markets the corresponding GDP shares. The use of the renminbi, which is not fully convertible, presently falls short of China's weight in the global economy.
International banking
The currency dimension is at the core of BIS banking statistics (see the box). Deposits of US dollars began to accumulate in banks outside the United States in the late 1950s, giving rise to concerns over their impact on the transmission of US monetary policy at a time when policy frameworks focused on control of monetary aggregates. This led to the collection, in the 1960s, of the BIS LBS, to track banks' international claims5 – the complement to domestic monetary aggregates. The LBS have since been expanded to capture how key currencies are used in international banking across countries and sectors.
The boom-bust cycle in banks' international claims largely reflects dollar flows, given the dollar's outsize role in international banking (Graph 2.A). In the three decades before the Great Financial Crisis (GFC), claims grew by more than 10% per year on average, but with considerable variation around crisis events (vertical lines). Variation in dollar claims accounted for most of this. Claims growth collapsed after the GFC and has been subdued since, as banks restructured their balance sheets and non-bank financial institutions gained ground in international finance.
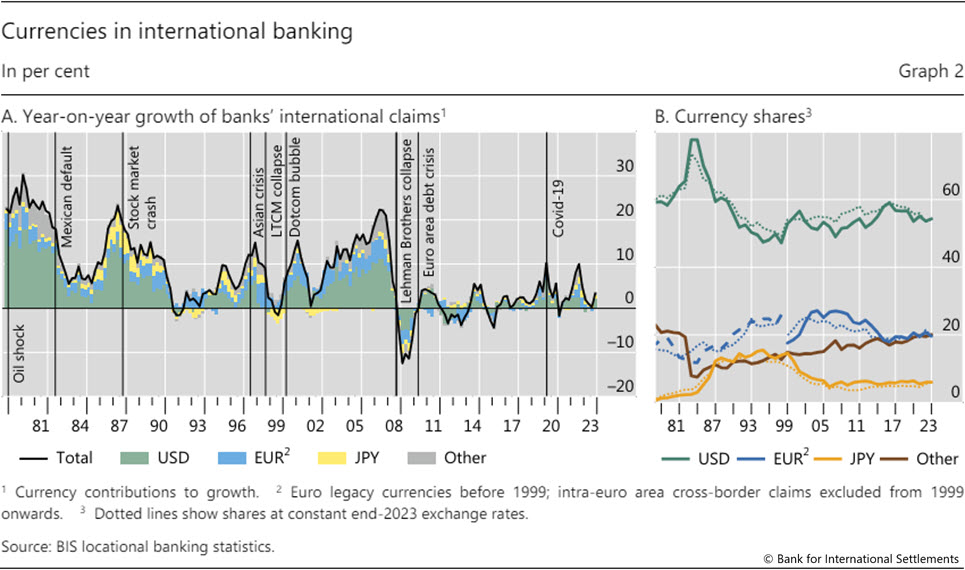
The dollar's share in banks' international claims peaked at almost 80% in the mid-1980s, after which it gradually lost ground (Graph 2.B). Yen claims gained share in the late 1980s, when Japanese banks expanded their global footprint amidst a domestic banking boom. Similarly, claims denominated in European currencies grew ahead of the introduction of the euro in 1999. And euro-denominated international claims rose rapidly after the currency's launch, propelling the euro's share to around 25% in the mid-2000s. It subsequently retreated in the wake of the euro area sovereign debt crisis of 2010–12, yielding ground back to the dollar.
The offshore use of the US dollar underpins its dominance in international banking. Traditional international banking typically involved cross-border positions in the domestic currency of either the lender or the borrower – for example, a dollar loan from a bank in the United States to a borrower abroad (Graph 3.A, tan area), or a dollar loan from a bank in Europe to a borrower in the United States (grey area). However, more significant for the dollar is the offshore segment (red area), ie dollar positions that do not involve residents of the United States (McCauley et al (2021)). Offshore dollar claims peaked at two thirds of total dollar claims in 2018. That share has since retreated as higher dollar interest rates have attracted investment in US securities, driving up cross-border claims on the United States (grey area).
Offshore use of the euro is small by comparison (Graph 3.B). Inward and outward claims involving euro area residents have long been the largest euro segments, mainly reflecting the euro business of banks in London with counterparties on the continent.6 Offshore positions have accounted for only about a quarter of the total. The rise since 2020 in cross-border positions booked by banks in the euro area (tan area) in part reflects revised reporting of derivatives positions on a gross basis.
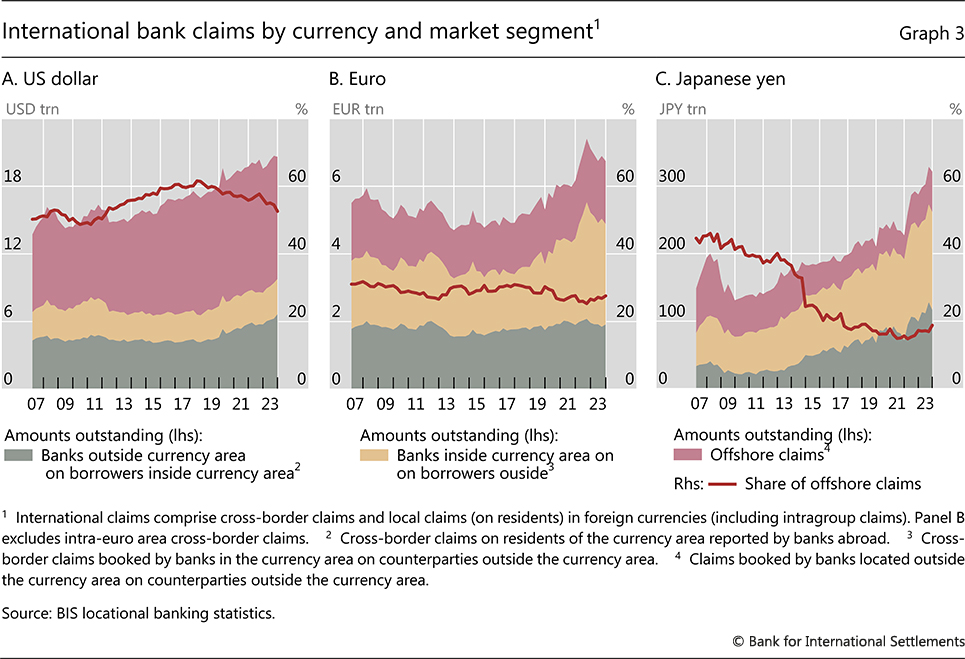
Offshore yen claims are smaller still, and their share in total international yen claims has fallen since the GFC (Graph 3.C). The decline in part reflects the contraction, in absolute terms, in the offshore use of the yen since 2008. At the same time, cross-border lending by banks in Japan (tan area) expanded after the GFC as these banks attracted new borrowers with low yen rates. In addition, banks elsewhere have bulked up their claims on borrowers in Japan (grey area). This in part reflected off-balance sheet FX derivatives transactions whereby banks swap dollars for yen and then park the yen proceeds in safe yen assets recorded on the balance sheet (ie the cross-currency basis trade).
Foreign currency credit
Borrowers have options beyond international banks for raising foreign currency funding. International debt securities (IDS) are issued outside the local market of the country where the borrower resides (Graph 4.A), unlike domestic debt securities.7 The BIS global liquidity indicators track total credit – ie both loans and bonds – denominated in US dollars, euro and yen to non-bank borrowers located outside the respective currency areas. These statistics reveal how borrowers' mix of loan and bond financing responds to borrowing costs and international market developments. Indeed, bond markets have eclipsed banks in the post-GFC period as a source of funding (Graph 4.B).
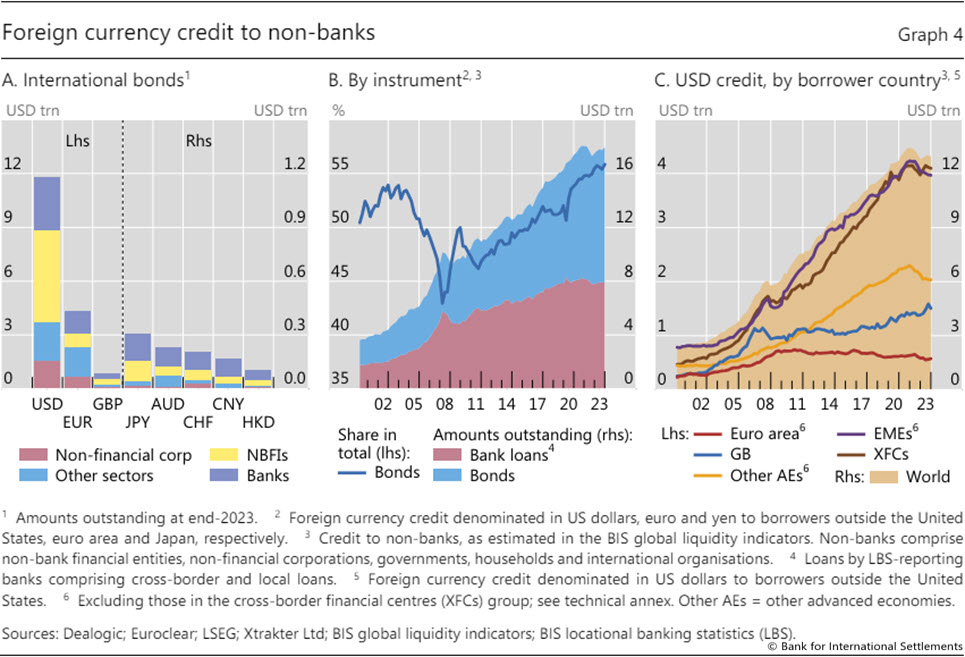
Prior to the GFC, foreign currency credit expanded rapidly, mostly to borrowers in advanced economies in the form of dollar- and euro-denominated loans (Graph 4.B). Light regulation of banks' leverage and accommodative monetary policy facilitated this expansion, which saw the share of bonds fall.
In the aftermath of the GFC, overall foreign currency credit growth slowed, and borrowers shifted to bond market credit (Graph 4.B). This came as banks retrenched after the GFC and remained constrained by tighter regulation and the drag from the euro area debt crisis. The expansion in dollar credit after 2010 was mainly to borrowers in EMEs and financial centres (Graph 4.C), amidst loose US monetary policy and strong incentives for investors to search for yield.
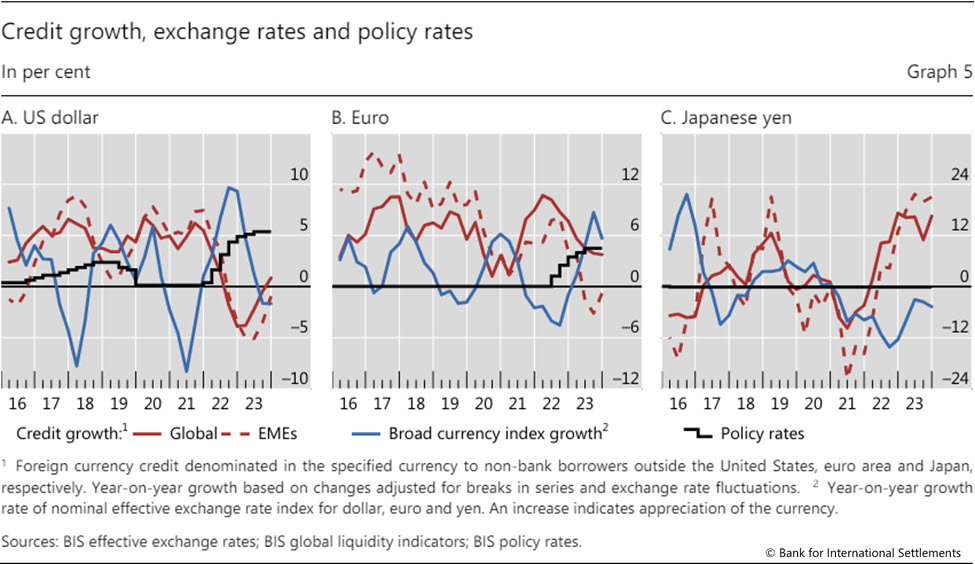
The macro-financial environment has recently undergone another major shift. The global surge in inflation since 2021 triggered a rapid monetary tightening worldwide, which ended the post-GFC low-for-long regime. US interest rates rose earlier and faster than those of other major currencies, and the dollar reached new heights (Graph 5.A). The euro also appreciated after the European Central Bank embarked on its tightening cycle (Graph 5.B). By contrast, the Bank of Japan's commitment to monetary easing and protracted depreciation have made the yen a preferred funding currency (Graph 5.C).
The growth in foreign currency credit has responded to these policy and exchange rate changes, exposing borrowers, especially in EMEs, to global factors (Graph 5). Since 2016, dollar credit to borrowers outside the United States tended to slow by 0.8 percentage points (ppt) when the federal funds rate rose by 1 ppt, or by 0.5 ppt when the broad dollar index appreciated by 1% (Graph 5.A). These co-movements have strengthened since end-2021, with credit to EMEs becoming more sensitive. Dollar strength can hurt dollar borrowers through the financial channel of exchange rates (Bruno and Shin (2015), Obstfeld and Zhou (2022)).
Foreign exchange markets
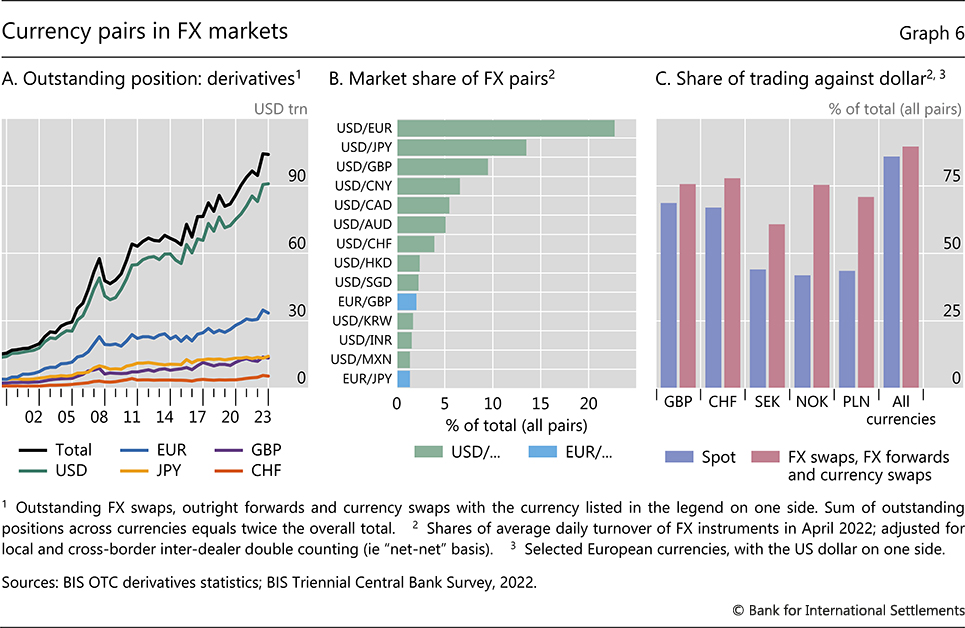
The largest market for borrowing dollars is the FX derivatives market. Outstanding FX derivatives – comprising mainly FX swaps, currency swaps and outright forwards –surpassed $100 trillion at end-2023 (Graph 6.A). 8 This roughly matched global GDP in 2023 ($105 trillion) and was four times global trade ($24 trillion). The churn of new deals surpassed $5 trillion per day in 2022. The dollar is the vehicle currency of choice – it was on one side of 90% of all FX derivatives trades.
Dollar dominance in FX derivatives is associated with the role of the dollar in international trade and as the main funding currency in global capital markets (Shin (2023)). Financial firms that manage asset portfolios and many non-financial corporates involved in international trade have a structural demand for dollar borrowing via FX derivatives to hedge exchange rate risk in their dollar portfolios and trade receivables (Borio et al (2017)). The bulk of the $56 trillion in dealers' outstanding positions with customers at end-2023 were with other financial firms, mainly non-bank financials such as pension funds and insurance companies.
The dollar's unrivalled dominance in FX markets is evident in the way it trades against specific currencies. The dollar was on one side of the top nine currency pairs, with USD/EUR trades alone accounting for 23% of global turnover (Graph 6.B). Notably, the dollar is dominant even in trades that involve the currencies of countries that border the euro area (Graph 6.C). These currencies trade substantially against the euro in the spot market, so that their dollar shares are lower than the global average (purple bars). Even so, for each currency shown, the dollar share in FX swaps/forwards trading (red bars) is more than half and higher than in the spot market.
The international use of currencies – implications
Currency composition shapes the interplay between exchange rates, balance sheet valuations and vulnerabilities in countries' external positions. Some implications are macroeconomic in nature. For instance, when trade is invoiced in dollars, it is the dollar exchange rate rather than that with other trade partners that determines pass-through to inflation (Boz et al (2022)). Trade invoicing practices also shape the composition of official reserves (Ito and McCauley (2019)). Other implications are financial in nature, eg when foreign currency debt in key currencies exposes debtors and creditors to policies and exchange rates in major economies.
This section discusses policy-relevant topics in international finance where a currency dimension in the statistics is essential. It covers the role of foreign currency debt of emerging markets, the geography of banks' foreign currency liabilities and the hidden dollar debt arising from FX derivatives.
Foreign currency debt of emerging markets
Exchange rate movements impart large valuation effects on amounts outstanding, swaying countries' external positions. A currency breakdown is thus crucial for assessing movements in countries' external positions.9 For most countries, the currency composition of external assets and liabilities differ. The United States, for instance, holds foreign currency assets but borrows mainly in dollars; its net external position thus improves as its currency depreciates. Countries that are net dollar lenders, on the other hand, see their external position deteriorate when the dollar weakens. Dollar strength, eg due to the flight to safety in crises, reverses these valuation effects, hurting net dollar borrowers.
Countries borrowing abroad in major currencies are most exposed to currency risk, ie the risk associated with exchange rate movements. The cost of borrowing in foreign currency depends not only on interest rates set by the currency-issuing country, but also on exchange rates: borrowers face the risk of their currency depreciating against the funding currency.10 Given the dollar's prominence, a stronger dollar tends to raise the burden of debt. Many EME crises have occurred during periods of dollar strength.
The perennial vulnerability of foreign currency debt has morphed over the decades. In the 1980s, dollar lending to governments fuelled the Latin American debt crisis. Reliance on foreign currency debt was similarly central to the crises of the 1990s (Graph 7.A), with corporate borrowing playing a greater role. Prior to the Asian financial crisis, foreign currency debt accounted for about 50% of GDP in Thailand, Indonesia and the Philippines. Several EMEs in Asia borrowed heavily from banks (black dots), as Latin America had in the 1980s. In the GFC, banks' own foreign currency funding needs took centre stage (see below). After the GFC, non-banks in EMEs increasingly met their foreign currency needs from bond markets (Graph 7.B).
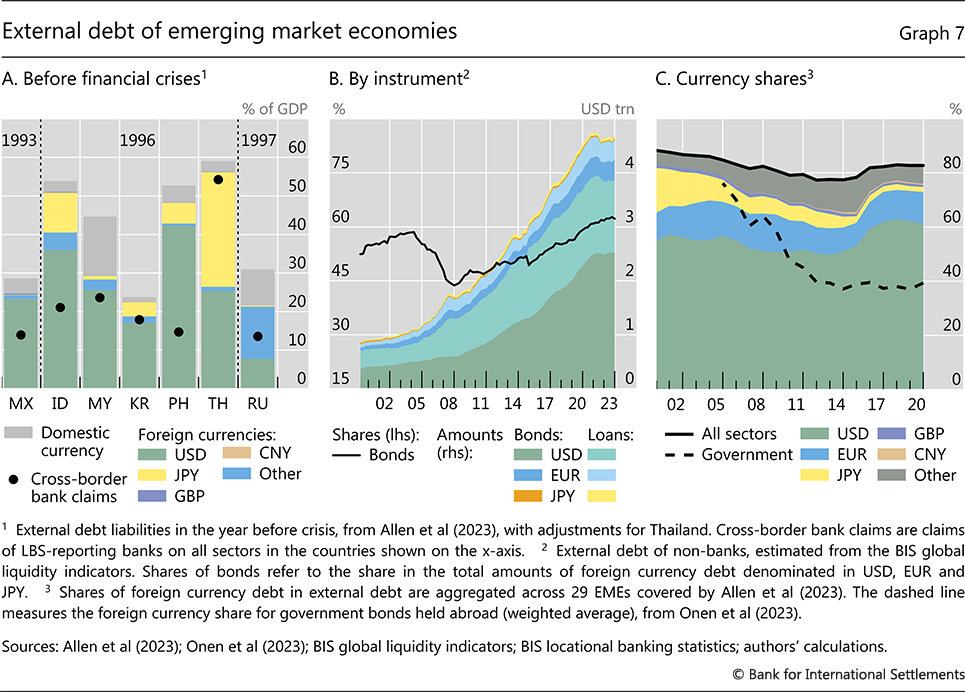
Since the 1990s, many countries have made efforts to reduce their dependence on foreign currency funding. The sovereigns in major EMEs, in particular, have increasingly borrowed in their own currency (Graph 7.C, dashed line) by attracting foreign investors to their domestic bond markets (Onen et al (2023)). Other sectors continue to depend on foreign currency debt (solid line).11 Overcoming this dependence, or "original sin", hinges in part on sound policies, deeper domestic markets, and strong institutions and fundamentals in EMEs. But progress has been hampered by global factors as well as by lenders who prefer to hold assets in dollars or in their own currency to avoid exposure to currencies that are costly to hedge (Maggiori et al (2020)). Indeed, "home bias" often reflects "home currency bias".
Foreign currency funding in international banking
Global banks manage currency risk by funding foreign currency assets with foreign currency liabilities or via FX derivatives. In either case, banks incur foreign currency payment obligations that must be repaid or rolled over into new contracts. The LBS has some of the breakdowns required – by currency, by bank nationality and booking location – for monitoring banks' on-balance sheet foreign currency assets and liabilities at the global level. Banks' foreign currency needs can be assessed from a nationality perspective, ie by grouping their operations based on the country of headquarters (McGuire and von Peter (2012), McGuire et al (2024)).
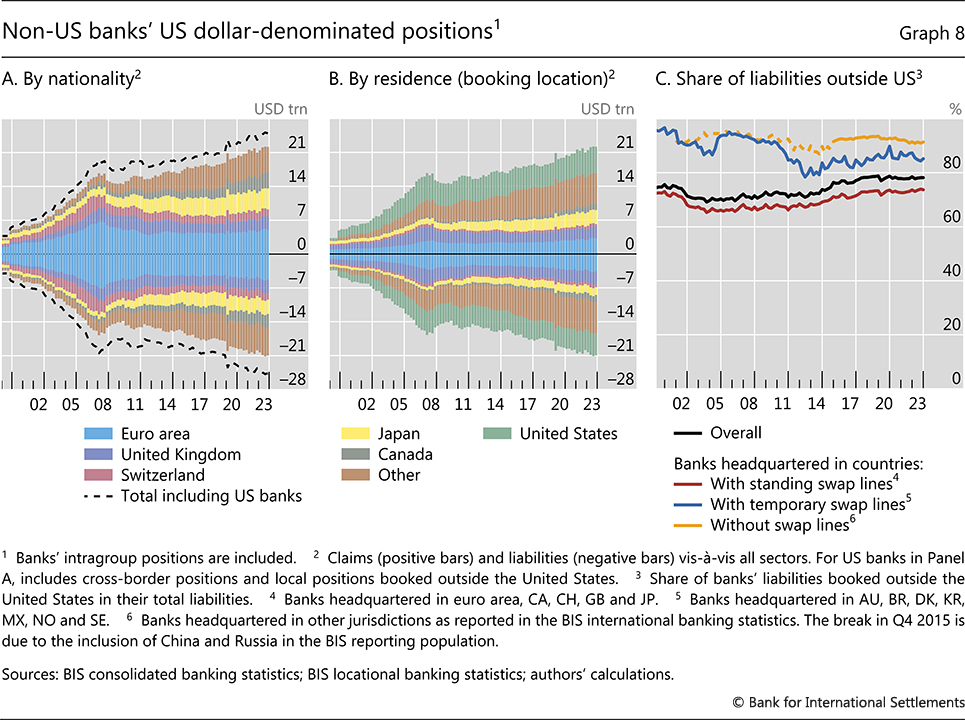
The dollar positions of non-US banks are a case in point. Their on-balance sheet dollar liabilities surged ahead of the GFC and later plateaued below the 2008 peak until 2016 (Graph 8.A). This mainly reflected a global retrenchment by European banks – they accounted for roughly two thirds of the total at end-2007 but for less than half by end-2023. The growth in non-US banks' dollar liabilities since the GFC has been driven mainly by banks from Canada, Japan and EMEs.12 By end-2023, non-US banks' combined dollar liabilities had reached $21 trillion. Their off-balance shet dollar obligations via FX swaps are estimated to be roughly double that (see below).
Non-US banks use their offices around the globe to source dollars and transfer them where needed using internal markets (Graph 8.B). Just under a quarter of their dollar liabilities are booked at their affiliates in the United States, where dollar funding markets are deep and banks have access to facilities at the Federal Reserve (Graph 8.C). The other three quarters, or $16 trillion, are recorded on the balance sheets of offices outside the United States where direct access to dollar liquidity is more limited.
Short-term funding markets, eg for commercial paper, repos and FX swaps, are subject to squeezes, as happened during the GFC and again in March 2020. These episodes were particularly acute for non-US banks as the US dollar is a foreign currency for them. Such banks had to pay a premium to roll over their short-term dollar funding, if they could borrow at all (Baba et al (2009), Eren et al (2020)). Extraordinary policy measures in the form of central bank swap lines were needed to restore market functioning. These enabled the Federal Reserve to provide dollars to select central banks (in exchange for their currencies) to be on-lent to borrowers in need of dollars. This framework provided access to dollars to banks accounting for roughly $11 trillion of dollar liabilities booked outside the United States.
FX derivatives and missing dollar debt
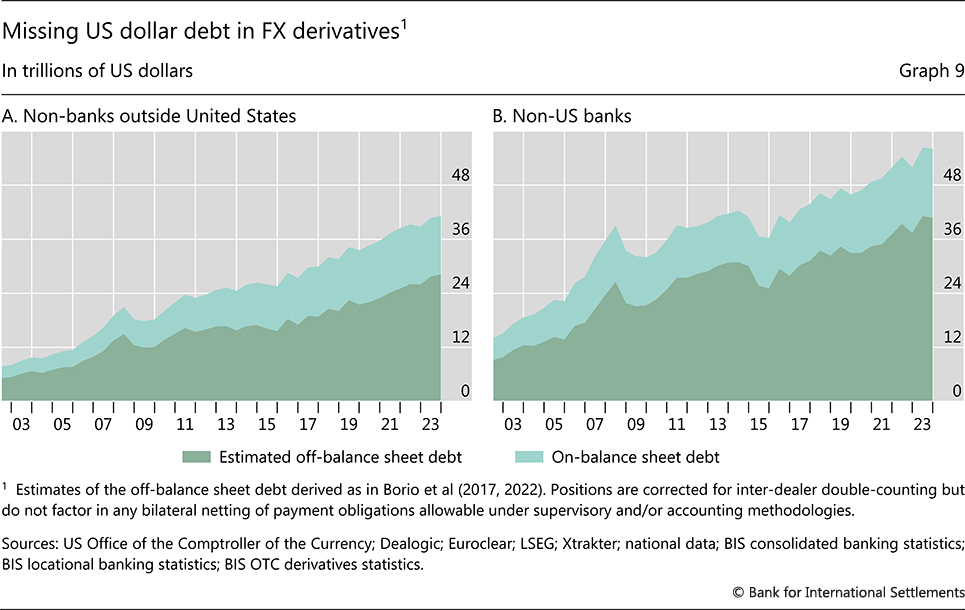
Dollar dominance in FX derivatives implies that off-balance sheet dollar payment obligations build up, which can contribute to maturity mismatches and thus liquidity strains. Unlike most other derivatives, FX swaps and forwards involve large payments, because the contracting parties exchange the full principal (notional) value. And in contrast to other forms of collateralised debt (eg repo), these payment obligations are not reflected on the balance sheet and are thus "missing" in standard debt statistics (Borio et al (2017)).
The dollar obligations from FX derivatives are staggering yet the location and identity of the obligors remain opaque (Borio et al (2022)). Dealer banks had $91 trillion in outstanding FX derivatives positions with the dollar on one side at end-2023, of which $56 trillion was with customers. Allocating these obligations to particular countries is not possible with the available data, leaving measures of countries' external foreign currency debt incomplete. However, estimates following Borio et al (2017) suggest half of that (ie $28 trillion) is owed by customers, mostly non-banks outside the United States that borrow dollars to hedge trade receivables and investments. This amount is roughly double their on-balance sheet dollar debt (Graph 9.A). For their part, banks headquartered outside the United States had an estimated $41 trillion in off-balance sheet dollar debt, compared with $15 trillion on their balance sheets (Graph 9.B).
Conclusion
The use of a few key currencies in international finance far outstrips their issuer country's share in global economic activity. The US dollar dominates in both absolute and relative terms in most international financial markets. This stems mainly from its use offshore, ie in transactions involving parties outside the United States. Other major currencies such as the euro, yen and pound have smaller international footprints.
Since currency denomination shapes capital flows, policy decisions taken in key currency areas spill over to the rest of the world. This has implications for the sustainability of foreign currency debt in emerging markets, for the stability of global funding markets in key currencies, and for the build-up of off-balance sheet foreign currency payment obligations. These pose policy challenges related to the provision of foreign currency liquidity in jurisdictions that lack direct access to central bank liquidity facilities in key currencies.
Identifying and addressing these challenges requires global data that have a currency dimension, covering both on- and off-balance sheet positions. BIS statistics provide good coverage in some areas of international finance, particularly for global banks' currency positions. Yet key data gaps remain, in particular the geography and currency denomination of off-balance sheet payment obligations and the role of non-bank financial institutions in the international domain. The BIS is working with central banks and other authorities to close these data gaps.
References
Allen, C, D Gautam and L Juvenal (2023): "Currencies of external balance sheets", IMF Working Papers, no 237, November.
Avdjiev, S, R McCauley and H S Shin (2016): "Breaking free of the triple coincidence in international finance," Economic Policy, vol 31, no 87, pp 409–51.
Baba, N, R McCauley and S Ramaswamy (2009): "US dollar money market funds and non-US banks", BIS Quarterly Review, March, pp 65–81.
Borio, C, R McCauley and P McGuire (2017): "FX swaps and forwards: missing global debt?", BIS Quarterly Review, September, pp 37–54.
----- (2022): "Dollar debt in FX swaps and forwards: huge, missing and growing", BIS Quarterly Review, December, pp 67–73.
Boz, E, C Casas, G Georgiadis, G Gopinath, H Le Mezo, A Mehl and T Nguyen (2022): "Patterns of invoicing currency in global trade: new evidence," Journal of International Economics, vol 136, 103604.
Bruno, V and H S Shin (2015): "Capital flows and the risk-taking channel of monetary policy," Journal of Monetary Economics, vol 71, pp 119–32.
Demski, J, R McCauley and P McGuire (2022): "London as a financial centre since Brexit: evidence from the 2022 BIS Triennial Survey", BIS Bulletin, no 65, December.
Eichengreen, B (2011): "The renminbi as an international currency", Journal of Policy Modeling, vol 33, no 5, pp 723–30.
Eren, E, A Schrimpf and V Sushko (2020): "US dollar funding markets during the Covid-19 crisis – the international dimension", BIS Bulletin, no 15, May.
Gopinath, G and J Stein (2021): "Banking, trade, and the making of a dominant currency", Quarterly Journal of Economics, vol 136, no 2, pp 783–830.
Ito, H and R McCauley (2019): "Currency composition of foreign exchange reserves", Journal of International Money and Finance, vol 102, 102104.
Maggiori, M, B Neiman and J Schreger (2020): "International currencies and capital allocation", Journal of Political Economy, vol 128, no 6, pp 2019–66.
McCauley, R, P McGuire and P Wooldridge (2021): "Seven decades of international banking", BIS Quarterly Review, September, pp 61–75.
McGuire, P and G von Peter (2012): "The dollar shortage in global banking and the international policy response", International Finance, vol 15, no 2, pp 155–78.
McGuire, P, G von Peter and S Zhu (2024): "International finance through the lens of BIS statistics: residence vs nationality", BIS Quarterly Review, March, pp 73–88.
Obstfeld, M and H Zhou (2022): "The global dollar cycle", Brookings Papers on Economic Activity, Fall, pp 361–427.
Onen, M, H S Shin, and G von Peter (2023): "Overcoming original sin: insights from a new dataset", BIS Working Papers, no 1075, February.
Rey, H (2001): "International trade and currency exchange", Review of Economic Studies, vol 68, no 2, pp 443–64.
Shin, H S (2023): "The dollar-based financial system through the window of the FX swaps market", speech at the Peterson Institute for International Economics conference on "Floating exchange rates at fifty", Washington DC, 24 March.
Technical annex
Graph 1: Computation of currency shares: A currency's international share is its share in inward, outward and offshore activity as a percentage of all currencies' activity in those segments. A currency's offshore share more narrowly measures its use in activity between non-residents of the currency area. The estimates and interpretation of these shares differ for each data set, depending on which segments are visible in the available data. For instance, the BIS LBS have the dimensions needed to measure these shares. In statistics with less bilateral information, the currency shares have to be approximated (or omitted) in Graph 1.
Trade invoicing is based on estimated invoicing shares of imports and exports in 2022 (based on Boz et al, (2022)), scaled by trade flows from IMF Direction of Trade Statistics. Data are available for USD, EUR, other foreign currencies and the domestic currency of each country.
FX reserves from IMF COFER are official reserves holdings at end-2023, available for eight major currencies and all other currencies combined. International shares are percentages of a currency in allocated reserves.
External debt from Allen et al (2023) is external debt liabilities, comprising portfolio debt, FDI debt and other investment liabilities, at end-2020. Data cover USD, EUR, GBP, JPY, CNY and the domestic currency of each country.
Int'l bank claims are from the BIS LBS by residence, end-2023, namely international claims reported by banks in BIS reporting countries on all counterparty countries, covering five key currencies (Box Table A) and CNY.
Int'l bonds are from the BIS IDS statistics, amounts outstanding at end-2023.
IRD turnover is the average daily turnover in OTC interest rate derivatives, in April 2022, from the 2022 Triennial OTC Survey (net-net basis).
FX turnover is the average daily turnover in all FX instruments (spot and FX derivatives) in April 2022, from the 2022 Triennial OTC Survey (net-net basis). Shares add up to 200% since FX transactions involve two currencies.
SWIFT is the 2023 average of currency shares in international payments excluding intra-euro area payments.
Graph 4: Cross-border financial centres comprise the following 23 jurisdictions, as defined in P Pogliani, G von Peter and P Wooldridge (2022): "The outsize role of cross-border financial centres", BIS Quarterly Review, June pp 1-15. BH, BM, BS, CW, CY, GG, GI, HK, IE, IM, JE, KY, LR, LU, MH, MT, MU, NL, PA, SG, SM, VG and VU. The names of jurisdictions corresponding to ISO codes are provided under the Abbreviations on page iv to vii.
1 This is the second feature in a series to showcase the BIS international banking and financial statistics, following McGuire et al (2024). We thank Iñaki Aldasoro, Stefan Avdjiev, Claudio Borio, Gaston Gelos, Bryan Hardy, Swapan Pradhan, Andreas Schrimpf and Hyun Song Shin for their helpful comments, and Marjorie Santos and Jhuvesh Sobrun for excellent research assistance. The views expressed are those of the authors and do not necessarily reflect those of the Bank for International Settlements.
2 Exceptions are economies that use another official currency (eg Ecuador and Panama use the US dollar and some European microstates use the euro). Some countries are unofficially dollarised.
3 Eichengreen (2011) discusses these factors with respect to the renminbi's prospects as an international currency.
4 Financial transactions are bilateral, but not all statistics capture the residence (or nationality) of both counterparties. Hence, the measurement of international and offshore currency shares differs across markets (see technical annex). Currency shares are thus more comparable within than across markets.
5 International claims (assets) comprise cross-border claims in all currencies and local positions vis-à-vis residents of the host country in foreign currencies. Claims comprise (i) loans and deposits; (ii) holdings of debt securities; and (iii) derivatives with a positive market value and other residual instruments. The sum of (i) and (ii) can be considered "credit".
6 This had included the clearing of euro-denominated repos at LCH Limited in London as repos are recorded as loans/deposits in cross-border banking positions. The shift of this business in 2019 to LCH SA, a subsidiary in France, has curbed offshore euro activity (red area). At the same time, the effect of the shift on the other euro segments is ambiguous. See Demski et al (2022) for more on how the shift in repo clearing affected cross-border bank claims.
7 A debt security is included in the IDS statistics if the residence of the immediate issuer differs from the location of the issue's registration, the governing law or the listing location. The classification does not depend on the currency of denomination or on the nationality of the issuer.
8 In an FX swap, two parties exchange currencies in the spot leg and reverse the trade at a future date at a pre-agreed exchange rate. Once the spot leg occurs, the remaining leg of the FX swap is indistinguishable from an outright FX forward. Currency swaps are FX swaps with a maturity longer than one year in which coupons are also exchanged.
9 Changes in external positions arise from changes in holdings, asset prices or exchange rates.
10 In principle, expected currency movements should offset interest rate differentials – a relationship known as uncovered interest parity (UIP). In practice, UIP often fails due to various factors such as risk, uncertainty, transaction costs, market inefficiencies and behavioural factors.
11 The share of domestic currency in external debt has risen over the past two decades, but 80% of external debt was still in foreign currencies as of 2020. External liabilities more broadly exhibit a greater shift towards domestic currency, mainly due to the expansion of non-debt liabilities (with equity and FDI equity both treated as domestic currency instruments in Allen et al (2023)).
12 Chinese banks' worldwide positions are only partially captured; China reports banks' cross-border positions but not local positions vis-à-vis residents of China.