BIS global liquidity indicators at end-September 2024

Key takeaways
- The BIS global liquidity indicators reveal that the ongoing weakness in dollar and euro credit to emerging Asia dates back to the respective starting points of the post-Covid Federal Reserve and ECB tightening cycles.
The BIS global liquidity indicators (GLIs) track total credit to non-bank borrowers, covering both loans extended by banks and funding from international bond markets.2 The latter is captured through the net issuance (gross issuance less redemptions) of international debt securities (IDS). The focus is on foreign currency credit denominated in the three major reserve currencies (US dollar, euro and Japanese yen) to non-residents, ie borrowers outside the respective currency areas.
Global foreign currency credit denominated in all three major currencies saw modest increases in Q3 2024. The $89 billion rise in dollar credit to non-banks outside the United States took its outstanding stock to $13.2 trillion (Graph 5.A, solid red line) and its annual growth rate to 2.7% (Graph 5.B, solid red line). Euro credit to non-banks outside the euro area expanded by €157 billion (8.1% yoy) and reached €4.4 trillion ($4.9 trillion) (Graphs 5.A and 5.B, solid blue lines). Yen credit to non-banks outside Japan rose by ¥263 billion in Q3 2024. This brought its outstanding stock to ¥64.7 trillion ($453 billion) and its annual growth rate to 19% (Graph 5.B, solid yellow line).
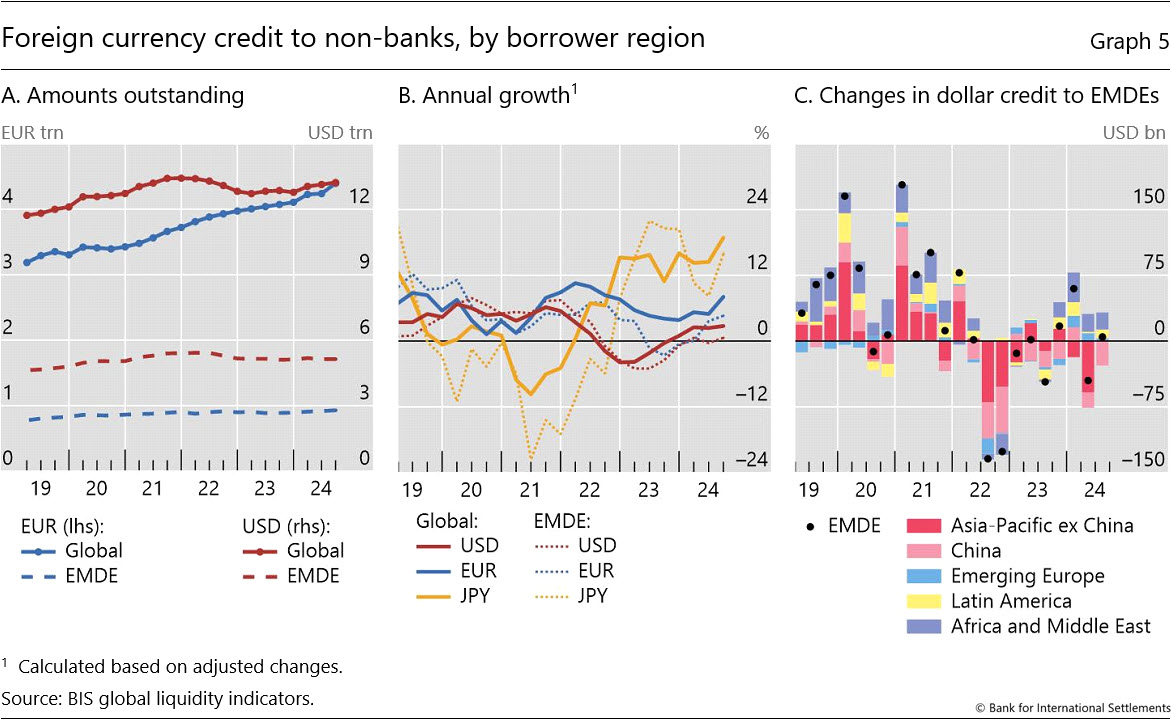
Foreign currency credit to EMDEs also saw modest increases for the three major currencies in Q3 2024 (Graph 5.A, dashed lines). Dollar credit to EMDEs rose by $5 billion (0.6% yoy), notwithstanding a contraction of $28 billion vis-à-vis China (Graph 5.C). Euro credit to EMDEs also increased slightly (€12 billion), primarily driven by Africa and the Middle East and emerging Europe. Meanwhile, yen credit rose by ¥415 billion ($3 billion), driven by emerging Asia-Pacific and Latin America and the Caribbean.
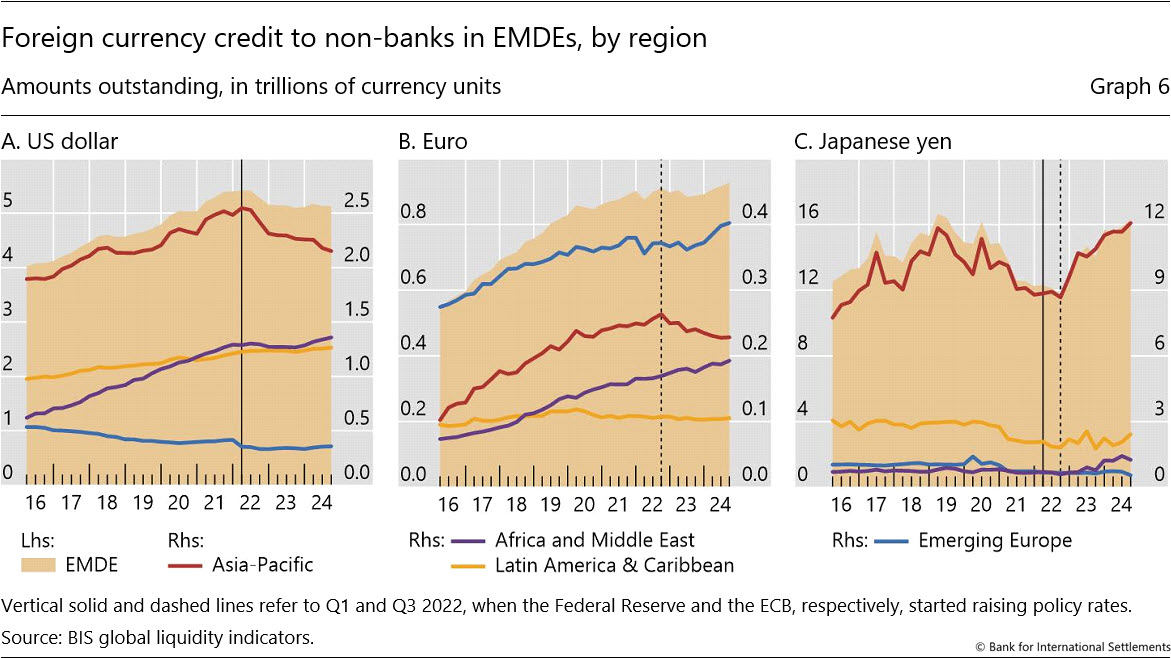
Taking a longer perspective, the ongoing trends in foreign currency credit to emerging Asia-Pacific date back to the starting points of the post-Covid Fed and ECB tightening cycles. Dollar credit to the region peaked in Q1 2022, when the Fed embarked on its latest tightening cycle. Since then, it has declined by almost $400 billion, or 15% (Graph 6.A, red line). Roughly half of this contraction was driven by dollar credit to China. Similarly, euro credit to emerging Asia-Pacific peaked in Q3 2022, when the ECB started raising its policy rate, and has contracted by €35 billion (or 13%) since then (Graph 6.B, red line). By contrast, yen credit to the region expanded by ¥3.2 trillion (or 36%) since Q1 2022 (Graph 6.C, red line).
In contrast to emerging Asia, the current trends in foreign currency credit to the other EMDE regions started long before the Covid pandemic. Dollar and euro credit to Africa and the Middle East have been rising steadily for almost a decade (Graphs 6.A and 6.B, purple lines). The notable divergence between (rising) euro and (falling) dollar credit to emerging Europe started in 2016 (Graphs 6.A and 6.B, blue lines). In the meantime, euro credit to Latin America has remained relatively flat, while dollar credit to the region has been on a modest, but steady rising path (Graphs 6.A and 6.B, yellow lines).
2 The GLIs cover total foreign currency credit denominated in US dollars, euros or Japanese yen, which includes loans from banks plus outstanding international bonds. This is broader than "bank credit" covered in previous sections, which captures banks' loans and their holdings of debt securities.