The valuations of tech stocks: dotcom redux?
Box extracted from Overview chapter "Carry off, carry on"
Over the past few years, equity prices have risen steadily, driven largely by the "Magnificent 7" (M7) tech giants. While their earnings growth has been strong, the rapid rise in their stock prices raises concerns about whether these valuations are driven by excessive optimism about future earnings, potentially echoing the dotcom bubble of the late 1990s.
The parallel with the dotcom bubble might seem fitting, as both periods saw a surge in the tech sector's share of the S&P 500 market capitalisation (Graph B1.A). In 2000, at the cusp of the dotcom bubble, the share of tech firms in the S&P 500 index reached 47%, doubling from 23% in less than two years. By end-August 2024, the share of tech firms had reached 49%, but the increase was more gradual, taking nearly a decade to double. These patterns reflect the overall dynamics of equity prices, with the S&P 500 tripling in real terms from 1995 to 1999, compared with a more gradual tripling over the past decade.
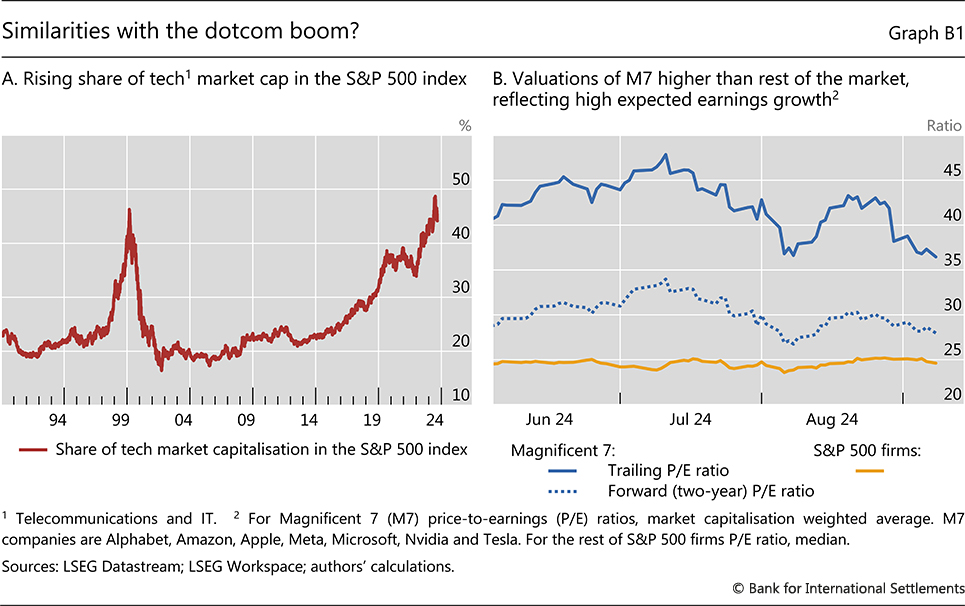
A common way to relate price dynamics to fundamentals is to look at price-to-earnings (P/E) ratios. They reflect how much investors are willing to pay for each dollar of earnings. P/E ratios can be calculated in a backward-looking (trailing) way, typically based on the past year's realised earnings, or in a forward-looking way, based on analysts' earnings forecasts. Trailing P/E ratios are grounded in actual results but may fail to react swiftly to changes in the outlook. Forward P/E ratios instead reflect expectations of growth, but they risk being biased by waves of over-optimism (or pessimism).
Since July, M7 stocks fell by around 25% and have not yet recovered. As a result, their valuations, as measured by the trailing P/E ratio, have not returned to levels seen at the beginning of June (Graph B1.B, blue line). However, these valuations remain over 45% higher than the median S&P 500 firm. This lingering optimism is also reflected in forward P/E ratios, which are, on average, 30% lower than their trailing counterpart.
The rising profitability of tech firms in the current bull market has helped propel their valuations, while during the dotcom bubble (1993 to 2001), the average return on assets (ROA) of tech firms steadily declined (Graph B2.A). To be sure, profitability levels also differed initially: in the early 1990s, profit margins of certain tech firms were sizeable, arguably thanks to still fairly immature markets and little competition. By 2015, the tech industry was more mature, with lower but growing profitability.
Despite the increasing profitability of the M7, their valuations may still be stretched. If markets are overly optimistic about future earnings, they may eventually be disappointed. One way to assess, ex post, whether forward-looking P/E ratios accurately reflect expectations is to compare forecasted and realised earnings. If earnings expectations are unbiased, the forecast and realised earnings would be aligned. For the M7, realised earnings actually tended to exceed analysts' predictions from 2011 to 2019; this is reflected in a slope steeper than one (Graph B2.B, red dots). This contrasts with the rest of the S&P 500, which shows a flatter slope and hence an optimistic bias in earnings expectations (Graph B2.C, purple dots).
 In recent years, however, the relationship between realised and forecasted earnings has changed for the M7: realised earnings during 2020–24 no longer exceeded expectations as much as before, and forecast errors also started to become more dispersed. This reflects both early signs of increased optimistic bias and higher uncertainty around M7 earnings (Graph B2.B, blue dots).
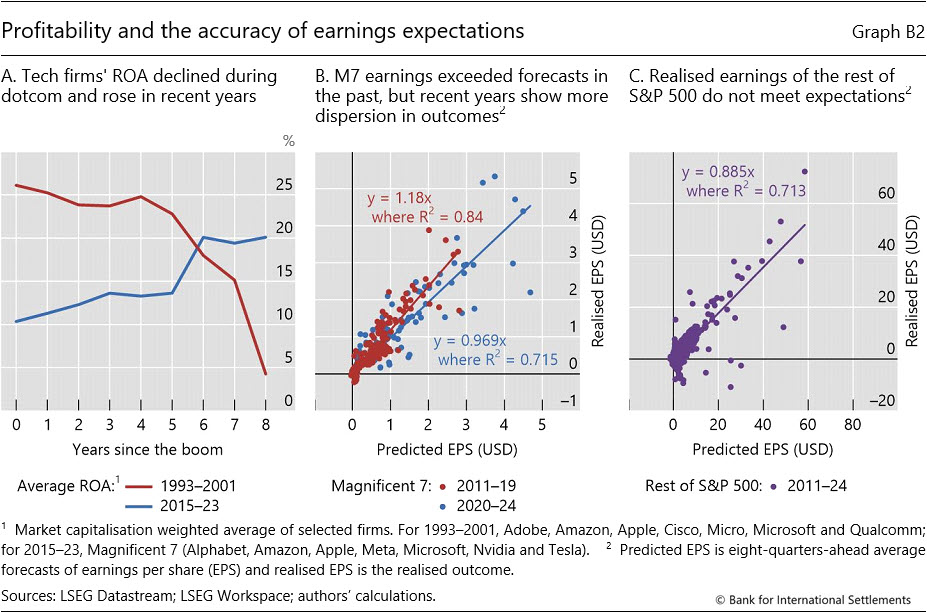
To sum up, until 2019, the M7's realised earnings tended to exceed expectations. But with loftier valuations, the likelihood of disappointments has been increasing. A reassuring aspect of the current M7 boom, compared with the dotcom bubble, is that price increases and the build-up of optimistic expectations have been more gradual and more rooted in rising profitability. That said, the streak of past positive surprises has been fuelling increasingly optimistic expectations, which may have become harder and harder to meet.
The views expressed are those of the authors and do not necessarily reflect the views of the BIS. P/E ratios mechanically rise when the growth of stock prices outpaces that of earnings, indicating optimism about future earnings growth. Higher P/E ratios may also reflect lower future discount rates, which this box does not address. See J Cochrane, "Discount rates", Journal of Finance, vol 66, no 4, August 2011, pp 1047–108. The literature documented the tendency for earnings expectations to be overly optimistic. See R La Porta, "Expectations and the cross-section of stock returns", Journal of Finance, vol 51, no 5, December 1996, pp 1715–42. P Bordalo, N Gennaioli, R La Porta and A Shleifer, "Diagnostic expectations and stock returns", Journal of Finance, vol 74, no 6, December 2019, pp 2839–74.