Carry off, carry on

De-risking began to stir financial markets over the review period but the stresses proved short-lived.1 While markets experienced sharp bouts of volatility, investors quickly reverted to the risk-on mode that had prevailed for several months. Financial conditions thus remained loose. Yet the turbulence illustrates how markets have become vulnerable to swift mood shifts, especially related to current growth jitters.
Although de-risking pressures had been brewing since the beginning of July, the cusp of the stress occurred at the beginning of August. In July, markets had already experienced some corrections, especially in tech stocks that had previously surged in valuations. Volatility had picked up, with early signs of deleveraging and a reversal of trades predicated on past trends and low volatility. In early August, following Federal Reserve and Bank of Japan policy meetings perceived as somewhat hawkish, markets overreacted to a disappointing US labour market release. While the equity market correction began in the United States on Friday 2 August, Japan emerged as a locus of turbulence the following Monday. Leveraged positions, above all carry trades, came under pressure, with the yen appreciating sharply and the stock market selling off. The equity slump and the currency repricing reverberated globally, and the VIX spiked. That said, markets stabilised remarkably quickly and erased losses within days, partly thanks to more benign incoming data and central bank communication. In early September, volatility resurfaced again when negative US macro releases led to another correction in equity markets.
During the August sell-off, currency carry trades unwound amid changing expectations of interest rate paths and heightened volatility. Since carry trades borrow in low interest currencies to invest in higher-yielding ones, the unwinding caused a sharp, if short-lived, appreciation of the funding currencies, predominantly the yen, and a depreciation of the investment currencies, such as the Mexican peso and other emerging market economy (EME) currencies. These fluctuations were large but not outsize compared with past carry trade crashes, and foreign exchange (FX) volatility did not rise nearly as much as that of equity markets. Moreover, even though EMEs were exposed to the unwinding of carry trades and spillovers of the risk-off mood, they withstood the bouts of volatility quite well.
Fixed income markets in major economies mostly reflected shifts in policy expectations and the growth outlook, even amid the turbulence. From July onwards, market participants began reassessing the odds of a soft landing. As signs of an intensification of the slowdown surfaced in early August, government bond yields fell markedly, as investors priced in more aggressive rate cuts. Concerns over a global slowdown led to more internationally synchronised movements across bond markets. This halted the divergence that had sustained US dollar appreciation since 2021.
Credit markets were the least affected by the bouts of volatility and de-risking. Corporate bond spreads did widen across advanced economies, but only marginally, and overall credit conditions remained benign by historical standards. Similarly, bank credit supply terms no longer tightened. Against this background, broad measures of financial conditions loosened. Towards the end of the review period, the risk-on mode was again in full swing but still vulnerable to sudden changes in mood.
Key takeaways
- The unwinding of leveraged positions, including carry trades, amplified short-lived bouts of extreme equity market volatility and exchange rate movements in early August.
- Equity markets underwent some drawdowns but overall managed to pull ahead fairly unscathed. Credit markets were even less affected, amid an overall environment of loose financing conditions.
- Markets remained hypersensitive to macro news, especially news that lowered the odds of a soft landing. Bond yields declined on any signs of slowdown, particularly at the short end.
Global bond markets price in easier monetary policy
Global bond markets moved in tune with expectations of an easier policy stance. Inflation continued its course towards targets, while macroeconomic readings indicated that growth momentum might be faltering. Hence, fixed income markets started pricing in earlier and larger rate cuts in most advanced economies, causing a rather synchronised decline in short-term yields globally (Graph 1.A). This macro backdrop also exerted downward pressure on long-term yields, albeit a more moderate one (Graph 1.B). As a result, the negative term spreads in advanced economies continued to narrow, even turning positive in some economies (Graph 1.C).
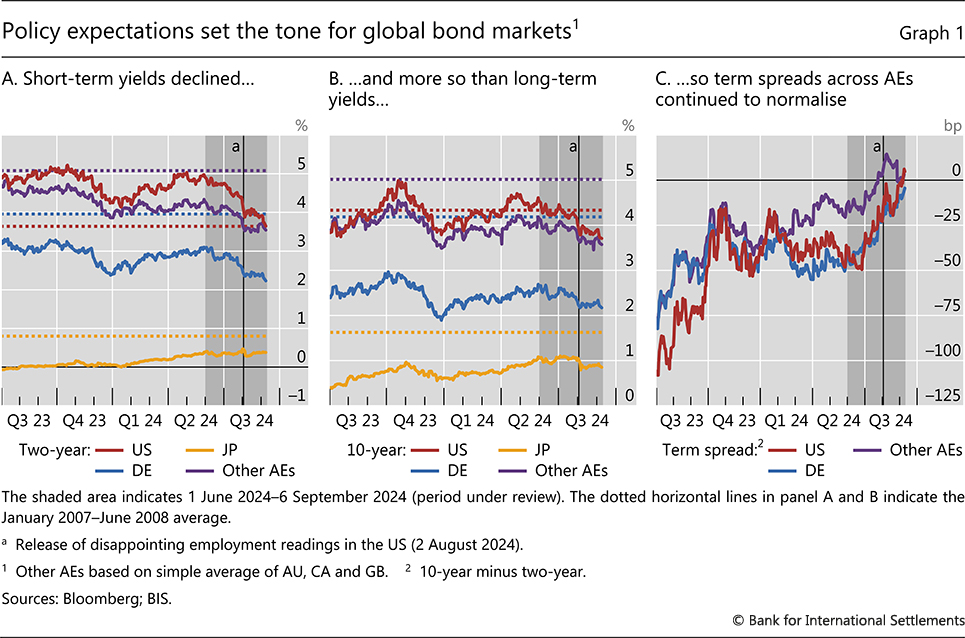
A major reassessment of policy expectations occurred in early August. Investors coalesced around somewhat negative labour market readings, interpreted as worrisome given the Federal Reserve's cautious approach to rate cuts. Fears that the odds of a sharp downturn were rising ignited the early August turbulence and led investors to price in a faster pace of rate cuts (Graph 2.A). A sharp decline in yields followed, including at the long end, possibly exacerbated by the unwinding of short positions and flight-to-safety flows.2 The macroeconomic releases of the following days, however, painted a rosier picture and, together with central bank communication, they briefly nudged up policy rate expectations. That said, these expectations eventually settled at a lower level at the end of the review period.
Overall, yield movements were increasingly driven by market participants' greater focus on growth-related news (Box A). This reflected inflation being seemingly on track towards targets and more prominent negative surprises about activity (Graph 2.B). Policy expectations were shaped by the evolving odds of a full-fledged recession versus a soft landing. Expectations of a more synchronous policy cycle ahead also led to more correlated movements in short- and long-term yields across core bond markets, in marked contrast to the divergence that had characterised the previous months. In turn, this likely contributed to halting the US dollar's appreciation trend, which had persisted since the initial policy rate lift-off in the United States.
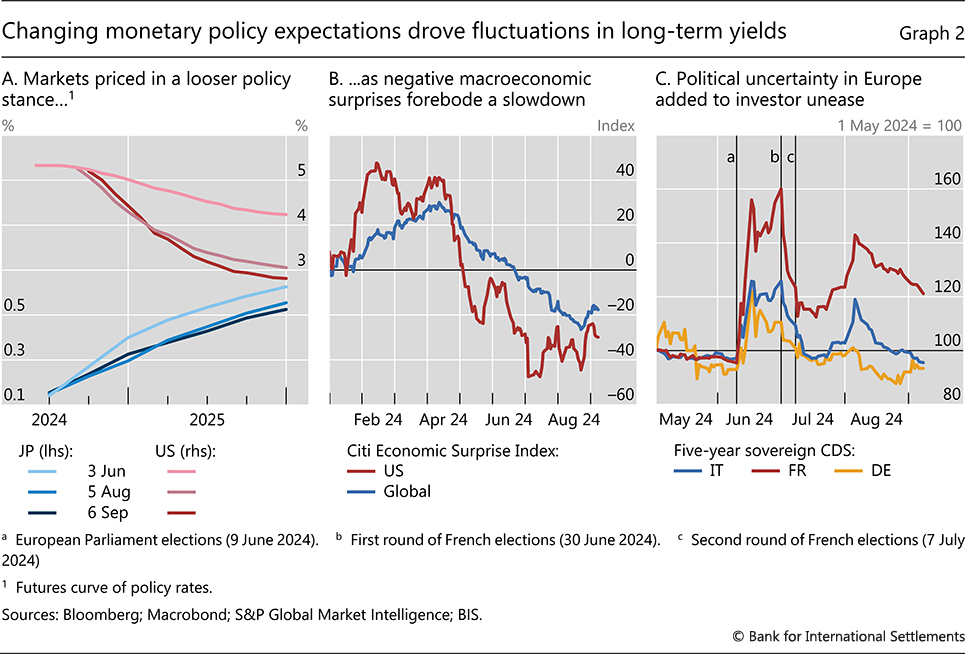
In Japan, policy expectations not only reflected the gradual tightening phase under way but also reacted to evolving central bank communication. As the Bank of Japan embarked on a monetary tightening in the spring for the first time in almost two decades, investors started pricing in higher policy rates ahead. Tighter funding conditions in Japanese yen were one of the triggers of the early August turbulence. As a result, in its aftermath, the Bank of Japan adjusted its communication to telegraph a cautious approach to further rate hikes. This led to an immediate downward shift in anticipated policy rates (Graph 2.A), as investors adjusted their expectations.
European fixed income markets were less affected by a reassessment of the policy path but experienced jitters for different reasons. The jitters came on the back of political developments and uncertainty related to elections in the United Kingdom, France and Germany. Notably, French credit default swap (CDS) spreads widened following the first round of parliamentary elections in June, with the associated geopolitical uncertainty affecting other euro area countries more broadly (Graph 2.C). Italian CDS spreads also widened, albeit less than the French ones. The CDS on German bunds, typically viewed as a safe asset in the euro area, ticked up unusually not only following the French elections but also after the elections in Saxony and Thuringia in early September. This possibly reflects increasing challenges in the political sphere. CDS spreads eventually narrowed for Italian and German bonds but remained wider for French bonds.
De-leveraging and carry trade unwinding amplify volatility
Risky assets, already vulnerable given seeping concerns about stretched valuations, were those most shaken in July and early August. Still, flare-ups of volatility subsided quickly each time, equity markets largely recovered the losses, and credit spreads re-compressed. In the end, markets eventually reverted to the risk-on mode as investors became increasingly convinced of policy easing ahead.
Throughout July, equities were highly responsive to any signs casting doubts on the sustainability of earnings, especially in segments that had previously seen a surge in valuations (Box B). Indeed, these lofty valuations were the first to suffer in the light of indications of possibly fading growth momentum. Those of tech stocks, mostly those of the so-called "Magnificent 7",3 began to drop rapidly in July (Graphs 3.A and 3.B). By contrast, the "rest" of the S&P 500 index was left relatively unscathed, and small caps were even boosted by some investment rotation.
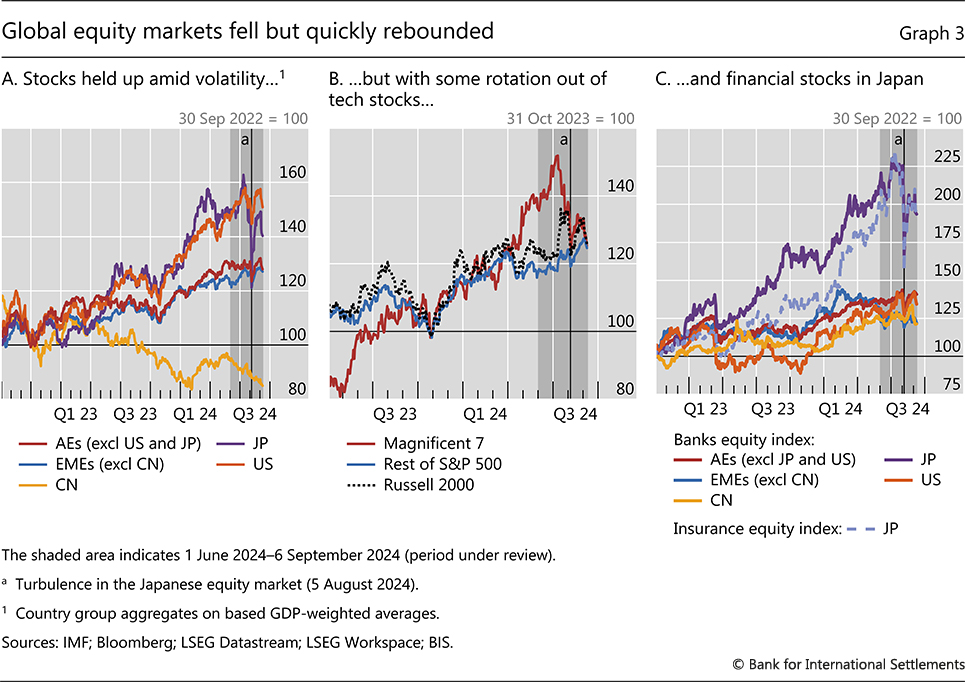
A larger bout of volatility followed in the first days of August. US equities resumed losses. Once again, the Magnificent 7, but this time also the riskier small caps (Graph 3.B), saw the largest drops. The trigger was investors' outsize reaction to a somewhat disappointing US labour market release on Friday 2 August. On the following Monday, the epicentre of the turbulence shifted to Japan, with the yen appreciating further and the TOPIX index posting double-digit losses. The sell-off broadened, with the TOPIX banks index suffering the worst one-day loss in its 40-year history (Graph 3.C). The Nikkei implied volatility spiked to crises-like highs (Graph 4.A). The volatility spike appeared to spill over to the VIX, which briefly exceeded 60 in pre-market trading before closing under 40, still an elevated level.
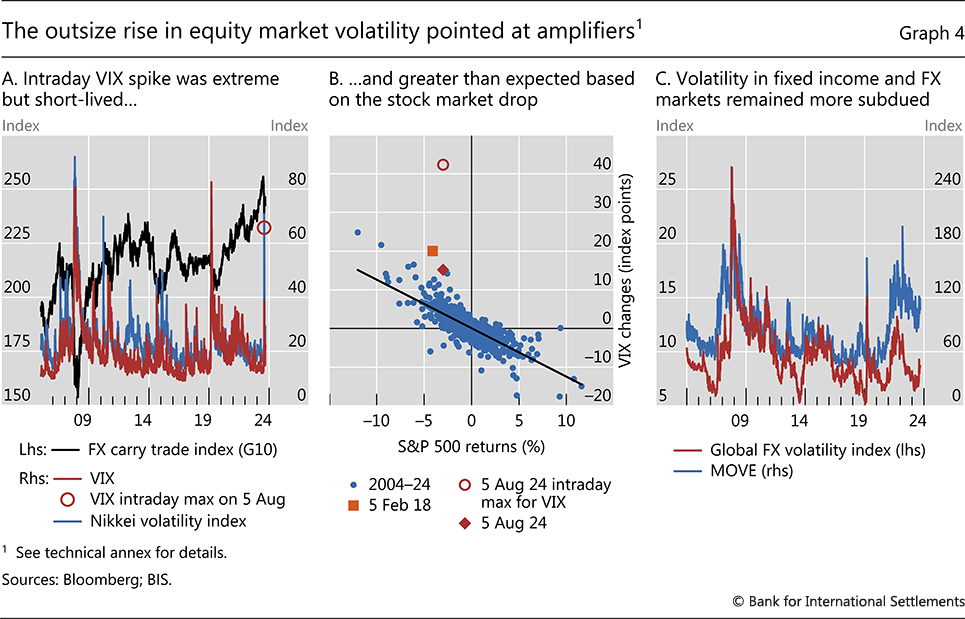
The large equity market drops, the extreme volatility spike and the apparent international spillovers pointed to amplification factors.4 The US news by itself could not be taken as an unequivocal sign of a deteriorating outlook, let alone a looming global recession, and did not warrant such a market reaction. Indeed, the jump in the VIX far exceeded what would have been expected based on the historical relationship with S&P 500 returns (Graph 4.B). The spike in the VIX appears to have been amplified by purchases of equity index options by traders exposed to volatility. For example, various structured products, including those funded in yen, were reportedly being hedged using equity options. And some specialised funds established short VIX positions while purchasing options on individual S&P 500 company stocks; these positions had to be reversed.5 More broadly, the spike in volatility coincided with strong deleveraging pressures and margin calls in a number of other asset classes, especially speculative ones such as crypto.
The risk-off episode saw large international spillovers. In fact, Japanese financial indices had already begun turning south in early July (Graphs 3.A and 3.C), when the yen's appreciation trend had reversed amid rumours of Bank of Japan FX interventions. This had altered the incentives for many leveraged speculators. Likewise, the equity market volatility spikes in late July and August went hand in hand with signs of an unwinding of currency carry trades. This is confirmed by data on speculative yen short positions in currency futures. Various hedge fund strategies, which had become crowded and more exposed to carry trades for at least a year, faced pressures and contributed to cross-asset spillovers (Box C).
All in all, the August turbulence proved short-lived. Possibly, less-constrained and cash-rich investors took advantage of the sell-off, while larger and more slow-moving positions funded in the yen, proxied with BIS statistics (Box D), may have been only partially shed. In less than a week, prices recovered lost ground and investors were once again eyeing a soft landing. And, despite the sizeable shock to leveraged currency positions, the impact on FX market volatility was not on par with any past episodes of market turmoil (Graph 4.C).
Yet another volatility flare-up, albeit on a much smaller scale, occurred at the beginning of September. Again, the repricing was triggered by disappointing macro releases, painting a gloomier outlook for the US economy. This underscores just how hypersensitive markets have become to growth-related news surprises and the associated revisions to expectations of the policy stance ahead.
In contrast to equity markets, volatility in credit markets remained subdued and conditions generally benign. Credit spreads on both investment grade and high-yield corporate bonds did widen somewhat in both the United States and Europe, but from quite compressed levels, and remained tight by historical standards (Graphs 5.A and 5.B). At the same time, broad measures of financial conditions remained in easy territory in advanced economies (Graph 5.C).
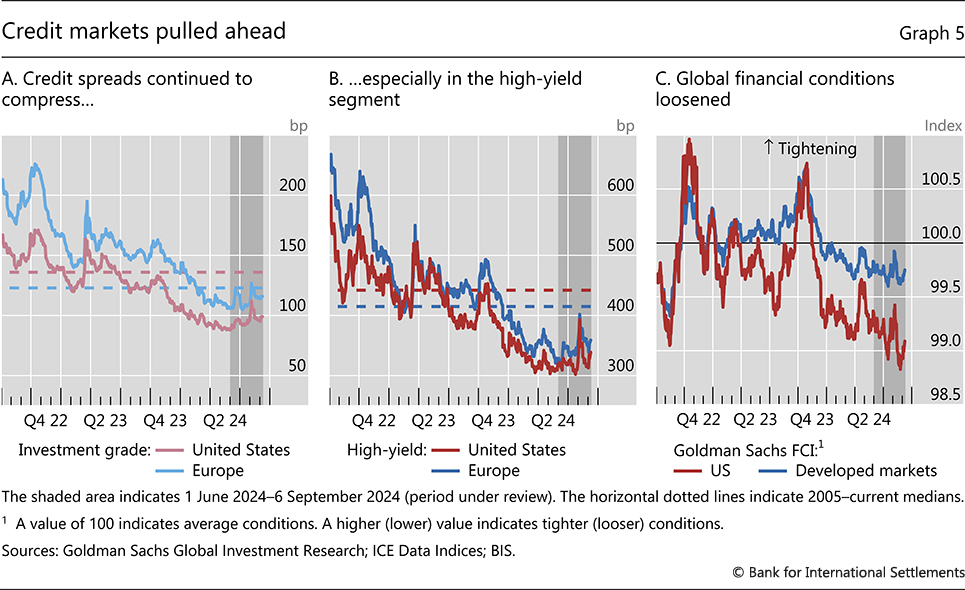
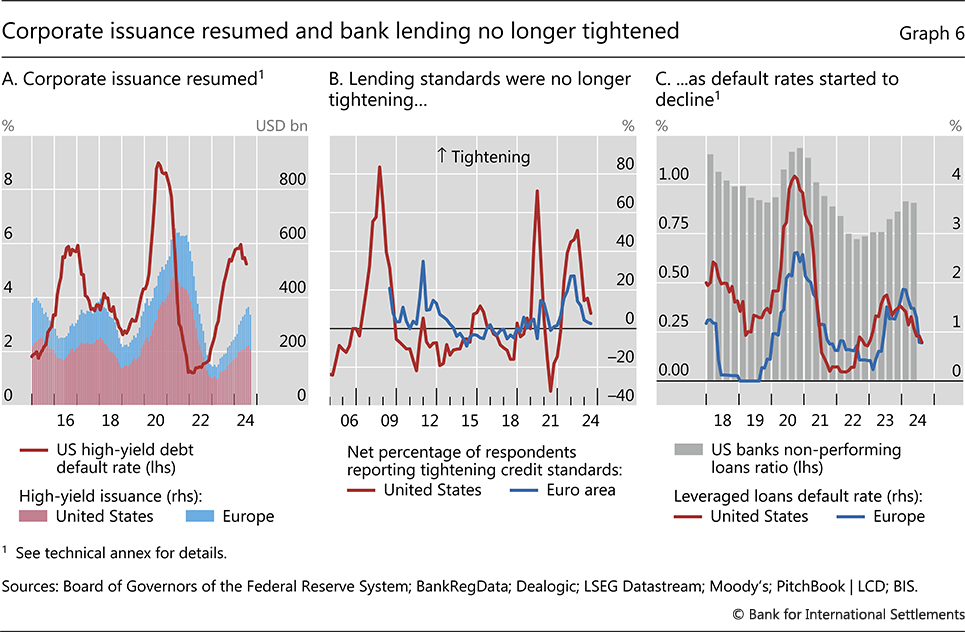
Relatively benign borrowing conditions and tight credit spreads encouraged firms to tap primary bond markets. Not least, issuance in the junk segment rose to pre-pandemic levels (Graph 6.A). In parallel, the tightening cycle of bank lending standards appeared to be nearing an end (Graph 6.B). Corporate default rates continued to decline, underpinning a broader easing of borrowing conditions (Graph 6.C). That said, in some segments of the US consumer credit market, such as credit cards and auto loans, delinquency rates rose further, raising questions about late cycle risks.
EMEs withstand spillovers but face macro headwinds
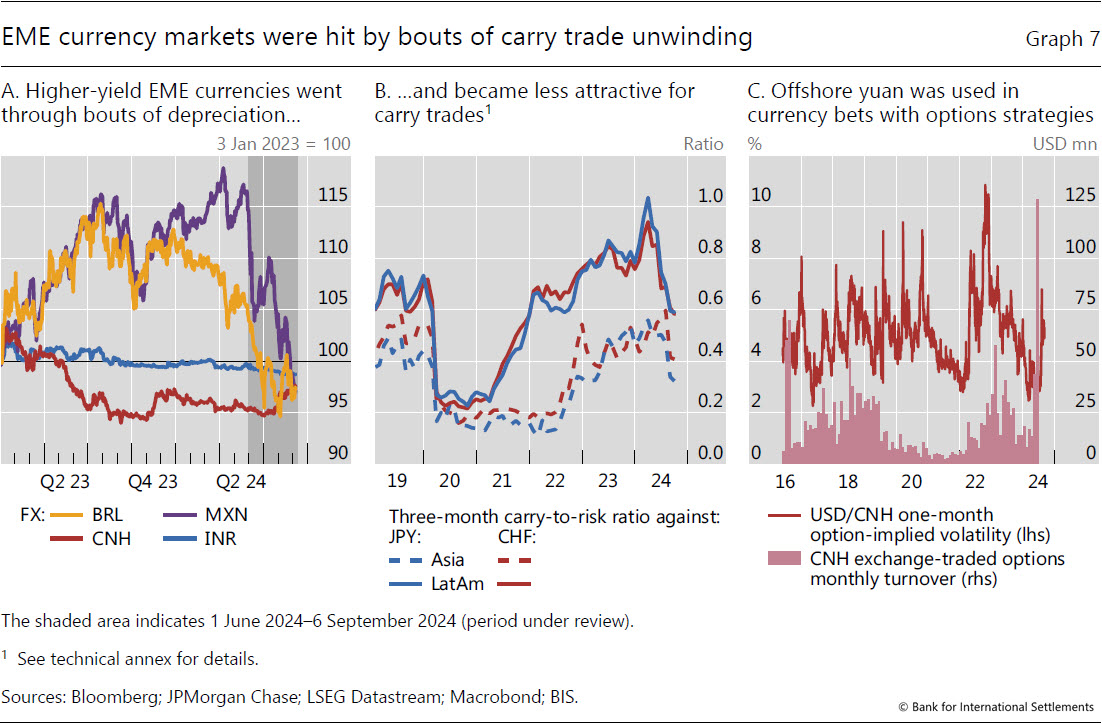
EME financial markets were also tested by the bouts of volatility and carry trade unwinding. A number of higher-yielding EME currencies depreciated, especially in Latin America, and the contagion reverberated through Asian currency and equity markets. Overall, EME financial markets managed to withstand the turbulence. At the same time, a weakening growth outlook and political uncertainty in some countries also gave rise to headwinds, prompting some central banks to ease their policy stance. This was also facilitated by an easier policy stance expected in major advanced economies. Chinese financial markets remained depressed, continuing to reflect domestic macroeconomic and financial woes.
Investment currencies popular with carry traders, such as the Mexican peso and Brazilian real, underwent bouts of depreciation amid de-risking episodes in late July and early August (Graph 7.A). The peso also fell steeply in June amid political uncertainties (see below). On a risk-adjusted basis, with a narrowing interest rate differential and a rise in volatility, Latin American currencies largely lost their appeal to currency speculators, as can be gleaned by falling carry-to-risk ratios (Graph 7.B).
In contrast with Latin American currencies, some emerging market Asian currencies appreciated noticeably during the August event. Most notably, the appreciation of the offshore yuan (CNH) was similar to that exhibited by the more traditional carry-trade funding currencies (eg the yen and the Swiss franc). For speculators, CNH had become a popular currency to short vis-à-vis higher-yielding regional currencies such as the Indonesia rupia and the New Taiwan dollar. As many Asian EME currencies have limited convertibility and are traded using non-deliverable instruments, the associated speculative bets mainly involved instruments such as currency options: CNH options-trading volumes ballooned in the run-up to the carry unwind (Graph 7.C).
EME equity markets were also tested by volatility spillovers originating from advanced economies. Asian markets were particularly exposed to the Japanese equities-led contagion on 5 August. The MSCI AC Asia Pacific Index saw its worst drop since 2023 (Graph 8.A). Stock indices of tech-heavy Asian economies were most affected, with the Taiex of Chinese Taipei seeing the biggest drop in over 30 years and Korean Kospi experiencing the worst decline since the 2008 Great Financial Crisis.
On top of the spillovers of the early August turbulence, EME financial market developments reflected ongoing macroeconomic challenges. Key sources of tensions were the mounting risks of a global slowdown. Slowing domestic growth also weighed on financial markets in some economies, such as China and Mexico. And in some countries, macroeconomic challenges were compounded by domestic political woes. For instance, the Mexican peso depreciated in June, following the surprisingly large victory margin of the ruling party, and further in August, with the scale of the announced potential constitutional and legal reforms. The Thai baht, in turn, dropped amid fiscal woes ignited by a change in government.
An easier expected policy stance in major advanced economies facilitated a turn towards policy easing across EMEs. Falling US government bond yields relative to local currency yields, as evidenced by the rise in five-year yield spreads (Graph 8.B), led to receding risks of depreciation and capital outflows. In countries where disinflation had progressed, central banks had already entered an easing cycle or were eyeing it. As a notable exception, investors increasingly expected the Central Bank of Brazil to hike rates, amid robust output and a challenging "last mile" in the fight against inflation.
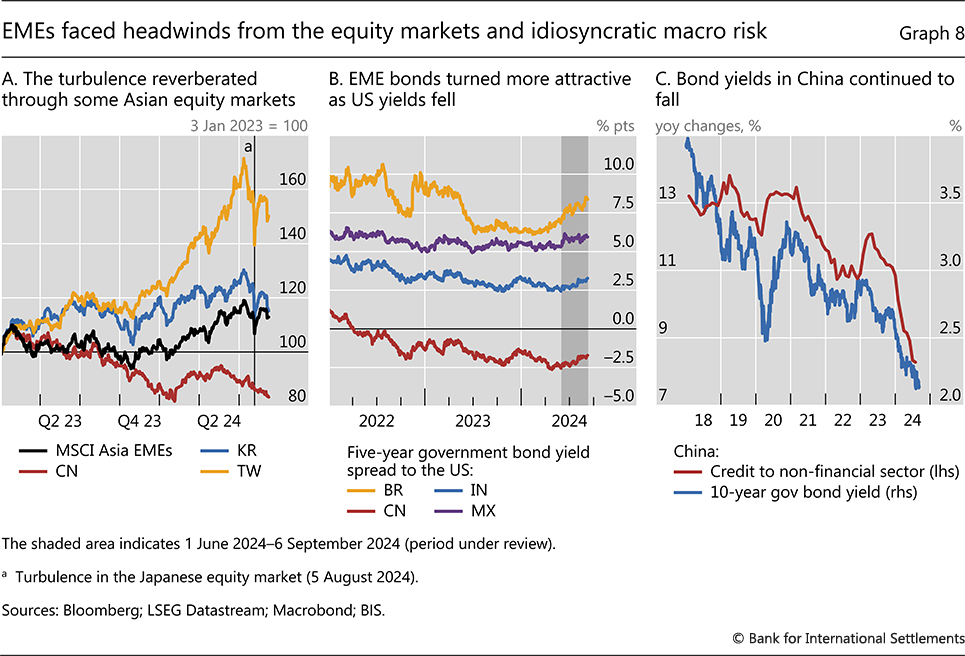
Investors were left with some overall question marks regarding the economic situation of China. Mainland Chinese markets did not move in tune with other EMEs and continued to face domestic macroeconomic and financial challenges. Government bond yields in China reached record lows and remained under downward pressure due to a slowing economy, falling prices and the associated policy easing. Furthermore, private savings had been increasingly channelled into Chinese government bonds, amid the shrinking set of attractive investment alternatives with faltering credit growth and a lacklustre stock market. Against this backdrop, Chinese authorities reportedly intervened in the bond market to try to put a floor under falling yields, as the latter approached 2% in August (Graph 8.C).
Technical annex
Graph 4.A: FX carry trade index (G10) = Bloomberg Cumulative FX Carry Trade Index for Managed G10 Currencies. Nikkei volatility index = The Nikkei Stock Average Volatility Index (Nikkei 225 VI), which is calculated by using prices of Nikkei 225 futures and Nikkei 225 options on the Osaka Securities Exchange.
Graph 4.B: 5 February 2018 is a known episode when the jump in the VIX was amplified by the covering of leveraged and inverse volatility trades.
Graph 4.C: Global FX volatility index = JPMorgan Global FX Volatility Index.
Graph 6.A: US high-yield debt default rate based on Moody's 12-month rolling US speculative grade default rates. High-yield issuance based on a 12-month rolling sum.
Graph 6.C: Twelve-month rolling leveraged loan default rates based, respectively, on Morningstar LSTA US Leveraged Loan Index (LLI) and Morningstar European Leveraged Loan Index (ELLI).
Graph 7.B: For JPY, Asia = CNY, HKD, IDR, INR, MYR, PHP, SGD and THB; while LatAm = ARS, BRL and MXN. For CHF, Asia = HKD, IDR, SGD and THB; while LatAm = BRL and MXN.
1 The review period covers 1 June to 6 September.
2 In line with this, various estimates of term premia in the United States point to a sharp decline in correspondence with the early August spike in volatility.
3 The Magnificent 7 companies are Alphabet, Amazon, Apple, Meta, Microsoft, Nvidia and Tesla.
4 For a detailed discussion of the market turbulence and carry trade unwind, see M Aquilina, M Lombardi, A Schrimpf and V Sushko, "The market turbulence and carry trade unwind of August 2024", BIS Bulletin, no 90, August 2024.
5 See also K Todorov and G Vilkov, "What could explain the recent drop in VIX?", BIS Quarterly Review, March 2024, pp 6–7. Other possible drivers include the aforementioned spillovers of the equity market volatility in Japan as well as a momentum reversal.