Deconstructing global trade: the role of geopolitical alignment

Globalisation is threatened as countries impose trade restrictions, especially against trading partners with large geopolitical differences. This feature gauges the impact of this development on trade flows using granular bilateral trade data across finely disaggregated sectors. We find that geopolitical distance – based on country votes at the United Nations – helps explain recent trade dynamics. The impact is sizeable: over 2017–23, we estimate that quarter-on-quarter trade volumes grew around 2.5% more slowly for geopolitically distant countries relative to those that were closer. We also assess how vulnerable individual countries are to an intensification of geopolitical tensions.1
JEL classification: F13, F14, F15, F51, F60.
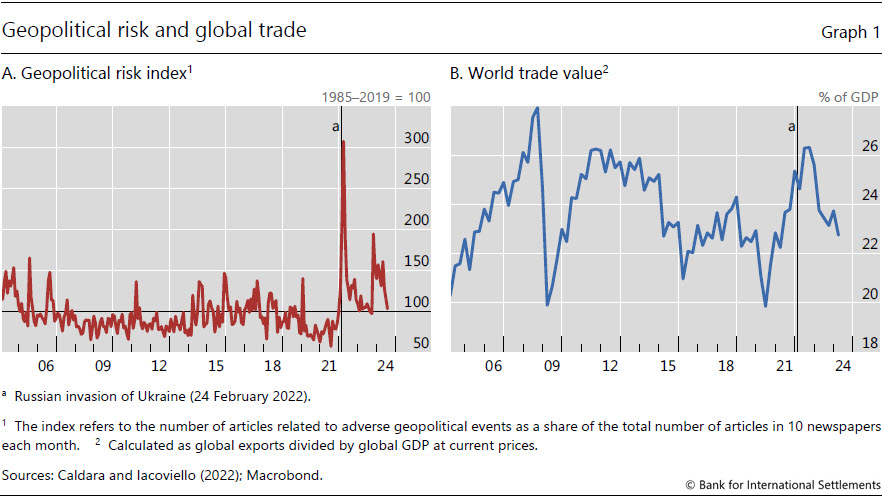
The slowdown in global trade, which intensified following Russia's invasion of Ukraine, has highlighted threats to globalisation. Since the end of the Second World War, the global economy has become increasingly integrated, with trade playing a central role. Increasing integration has been an engine of economic growth, allowing countries to specialise in the goods and services in which they have a comparative advantage. However, rising geopolitical tensions have fuelled concerns about a possible retreat from globalisation, sometimes called "deglobalisation". As an illustration, a popular measure of geopolitical risk based on press articles displays a noticeable spike around the time of the Russian invasion of Ukraine and has remained elevated thereafter (Graph 1.A). Meanwhile, the total value of global trade as a share of global GDP peaked soon after the invasion and has declined since (Graph 1.B).
In this special feature, we examine the relationship between geopolitics and trade flows. Specifically, we measure the geopolitical alignment between countries based on the degree to which they vote similarly at the United Nations (UN) and investigate how this is related to their trade dynamics between 2017 and 2023. Moreover, we assess individual countries' vulnerability in terms of imports and exports to any escalation in geopolitical tensions.
Key takeaways
- Geopolitical alignment influences trade volumes: we estimate that between 2017 and 2023 the quarter-on-quarter change in trade volumes was 2.5% lower on average between geopolitically distant countries relative to those that were closer.
- By contrast, the sensitivity of trade prices to geopolitical alignment was limited overall.
- Managing trade risks from geopolitics is challenging: the countries most reliant on geopolitically distant trading partners tend to have limited alternatives for diversion.
We focus on trade data, comprising prices and volumes, for narrowly defined sectors across many country pairs. Compared with simply looking at country-level trade value data, as is common in other work, our "looking under the hood" approach has several advantages. First, it helps us to control for other factors that also shape international trade, such as the strength of supply and demand within individual sectors in different economies. Second, it allows us to break down the impact of geopolitics on trade into its effect on volumes and prices. Third, it allows for a heterogeneous impact of geopolitics on trade flows across different sectors. And fourth, we can provide an assessment of the vulnerability of different countries to an escalation in geopolitical tensions, based on how dependent countries are on others that are geopolitically distant and the availability of alternative trading partners, at the sectoral level.
Our main takeaways are the following. First, geopolitical alignment influences the volume of trade materially. We estimate that the quarter-on-quarter trade volume grew by around 2.5% less for geopolitically distant countries relative to geopolitically close ones over the 2017–23 period, after controlling for other factors. Second, the effect of geopolitics on prices received by exporters2 was weaker. We find that the direction of the impact was ambiguous, and the size was generally small. And third, we highlight the risks to trade posed by geopolitical flare-ups, based on the degree to which trade is concentrated on geopolitically distant countries and how difficult it is to divert trade from these trading partners. We document that the countries most reliant on geopolitically distant trading partners tend to have more limited alternatives for diversion, highlighting the challenge of managing trade risks.
While our results are broadly consistent with past studies based on alternative approaches using aggregate data (Blanga-Gubbay and Rubínová (2023), Campos et al (2023) and Gopinath et al (2024), for example), we also go beyond them in important ways. Extant work focuses only on the decline in the value of trade. Our approach, by contrast, allows us to go a step further and show that this decline is largely explained by a fall in trade volumes; trade prices have contributed little.
The feature proceeds as follows. In the following section, we outline the ways in which geopolitical alignment affects trade dynamics and highlight the advantages of using granular data. Next, we provide estimates of the effect of geopolitics on trade prices and trade volumes. We then explore countries' vulnerability to any further rise of geopolitical tensions, before concluding.
How does geopolitical alignment affect trade?
Geopolitical alignment can affect trade flows. This is because countries tend to have different trade policies, including tariffs, restrictions and licensing requirements, towards geopolitical allies compared with adversaries. The less geopolitically aligned two countries are, the greater the likelihood that trade barriers will be put in place, and the higher any such barriers are likely to be.
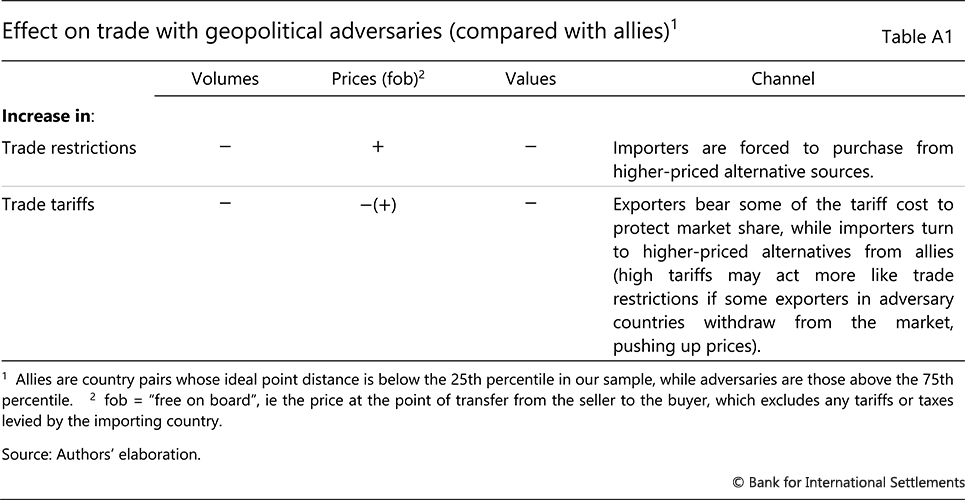
Table A1 in the annex lays out some of the channels through which trade policies can affect trade. It focuses on trade volumes, prices and the value of trade with adversaries compared with allies.
The effect of trade policies on trade volumes to adversaries is likely to be negative. Quantitative restrictions (such as quotas or export bans on geopolitical adversaries) will directly lead to this outcome. Tariffs can have a similar effect, working indirectly through prices. Additionally, these restrictions may lead to trade being rerouted through third-party countries, which reduces the direct trade volume between adversaries.3
Further reading
On prices received by exporters, the effect is ambiguous. On the one hand, for tariffs imposed on trade between geopolitical adversaries, exporters may cut their prices to offset part of the tariff and protect their market share, with the size of the cut constrained by their profit margins.4 On the other hand, if some exporters choose to exit the market altogether, prices for the remaining exporters could rise, especially if adversaries' and allies' exports are poor substitutes for each other. Likewise for quantitative restrictions: prices from adversaries are likely to rise due to their relative scarcity.
Complicating matters, the expectation of restrictions is likely to see adversaries move trade forward to avoid the constraints. This would increase trade volumes (compared with trade between allies) temporarily. The impact on prices, however, could go either way: if importers react more strongly, their increased demand is likely to see prices rise, whereas if exporters do, their increased supply can see prices fall.
Taking all these channels together, geopolitical factors are likely to see a decline in trade volumes between adversaries compared with allies, with the possible exception of a temporary bump before the implementation of anticipated measures. For prices, the effect of geopolitics could go in either direction.
Data
We turn to assessing the impact of geopolitics on trade dynamics in recent years. We make use of bilateral trade data at the sectoral level. Our primary data source is the six-digit Harmonized System (HS) of bilateral trade data from the UN Comtrade data set. The data include bilateral export volumes and values (measured in US dollars) for around 5,000 sectors at monthly frequency. Following Amiti et al (2024a,b), we aggregate the data from monthly to quarterly frequency to reduce their volatility. We then compute prices as the ratio of values to volumes. We focus on a sample of 32 economies. These are the top 50 trading countries (ranked by total trade value) with data available every year from 2017 to 2023.5 This unfortunately excludes Russia and Korea, among others, due to incomplete data. That said, it still captures any indirect effects working through third-party countries.
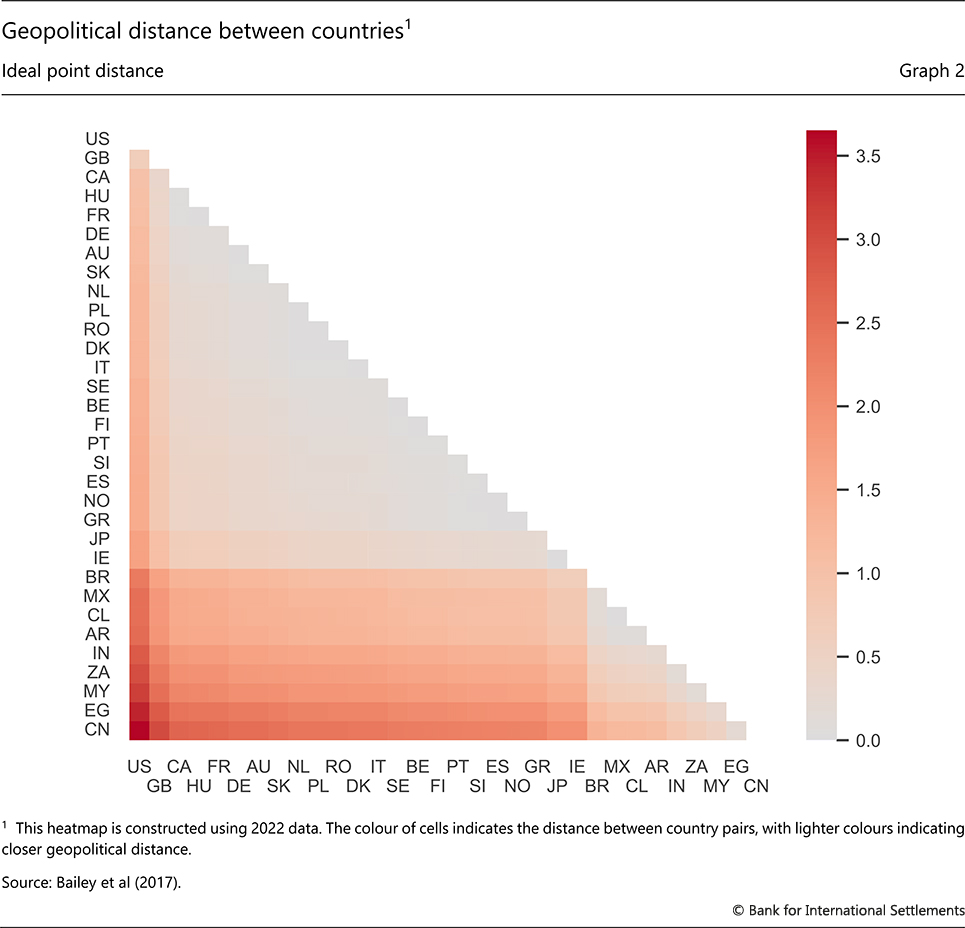
We measure geopolitical alignment between trading partners based on UN voting records. We rely on a distance metric proposed by Bailey et al (2017) that is often used in the literature as a proxy for geopolitical distance. Based on observed votes, they estimate a time-varying annual measure of each country's political preferences, referred to as its "ideal point". They then calculate the "geopolitical distance" between each pair of countries as the distance between their ideal points (Graph 2). The larger the distance, the less aligned the two countries are. Based on this approach, country pairs, say, within the European Union are generally very close to each other. Conversely, the United States and China both tend to be geopolitically distant from many of the other countries in our sample.6
Event study: trade dynamics after the Russian invasion of Ukraine
We can get a glimpse of the role of geopolitical alignment on trade using an event study centred around the time of the Russian invasion of Ukraine. To do so, we compare changes in trade growth between countries that were more geopolitically aligned with those that were less so. If geopolitical distance did not affect trade flows, we would expect to see similar trade changes regardless of geopolitical alignment.
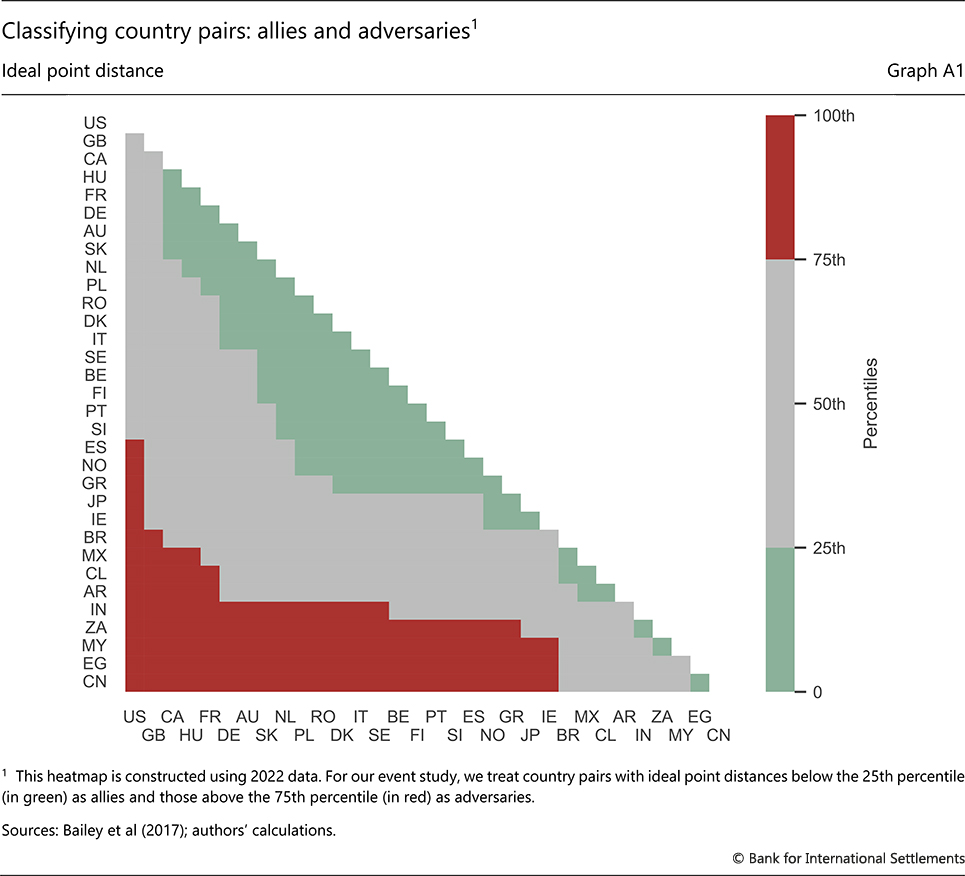
We label country pairs "allies" or "adversaries" based on their geopolitical alignment. Allies are country pairs whose geopolitical distance is below the 25th percentile in our sample each year, while adversaries are those above the 75th percentile. See Graph A1 in the annex for our classification of country pairs.
A simple comparison suggests that some trade flows between adversaries were diverted to allies. We calculate the change in the average quarterly growth rate of trade from the four quarters before the invasion to the four quarters that follow. The value of trade calculated this way declined for both groups, but more so for adversaries (Graph 3.A).
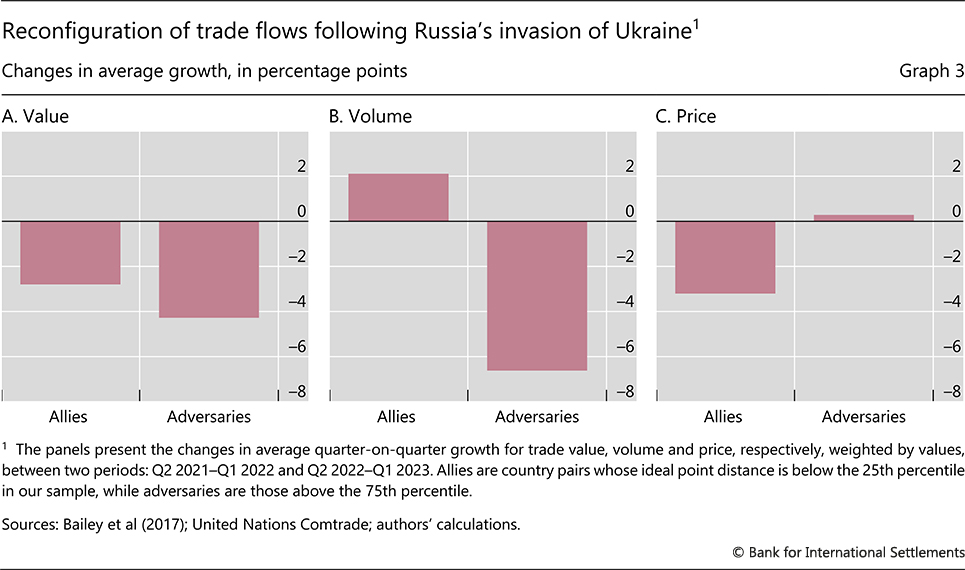
Beyond trade values, geopolitical factors seem to play out differently for trade volumes and prices. We observe a significant decline in the average quarter-on-quarter growth rate of trade volumes between adversaries, of more than 6%; for allies, by contrast, volumes picked up by 2% (Graph 3.B). Conversely, we see a decrease in the average quarterly growth rate of prices between allies to the tune of 3%, but no material change between adversaries (Graph 3.C). This highlights the importance of analysing trade prices and volumes separately: focusing on trade values alone will miss potentially distinct dynamics of volumes and prices.
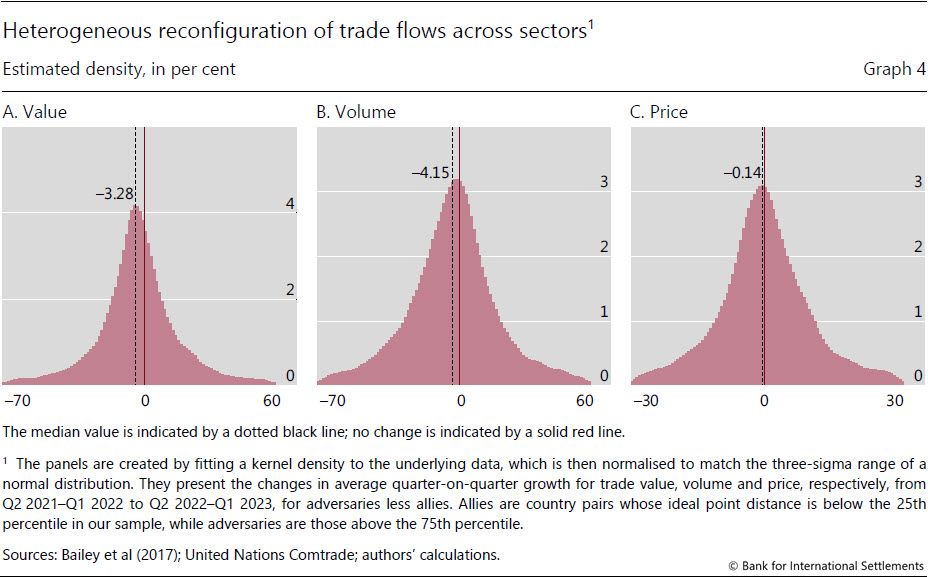
The impact of geopolitical factors also differs across sectors (Graph 4). When zooming into the bilateral trade reconfiguration for individual sectors, the outcomes are very diverse. Take the change of trade value growth, for example: the gap between allies and adversaries, not controlling for any confounding factors, varies between –70% and +60%. Thus, some sectors saw very large increases in trade between geopolitical allies compared with adversaries, while others saw the opposite.
The exercise above provides suggestive evidence of the effects of geopolitics on trade dynamics but could be misleading if factors other than geopolitics influenced trade patterns. For example, a slowdown in an economy that is geopolitically distant from most other countries could lead trade flows between adversaries to decline, independent of geopolitics. Further, trade patterns may have been distorted by the Covid-19 pandemic and its aftermath. We therefore now move to a more comprehensive model that does a better job of controlling for confounding factors.
Quantifying the impact of geopolitical distance on trade
To quantify the impact of geopolitics on trade, we estimate an equation that explains trade dynamics using geopolitical distance and other factors. We model the growth rate of bilateral trade volumes and prices for each of nearly 5,000 narrowly defined sectors, based on the geopolitical distance between trading partners as well as supply from exporters and demand from importers. We then aggregate these effects across sectors, based on trade shares, to calculate the overall impact of the factors on bilateral trade.
Specifically, we assume that trade between a country pair, for a given sector and time period, can be explained by:

where the dependent variable i is the quarter-over-quarter percentage change in volume (V) or log change in price (P) from country i to country j for sector h in quarter t.
Coefficients αhjt and βhit are fixed effects for importers and exporters respectively. Including these in the regression is crucial to control for the effects of demand from importers and supply from exporters. Intuitively, we assume that a change in trade that is common across all exporting countries to a given importing country j is related to the demand of the importing country and will be captured by αhjt. Likewise, we assume that a change that is common across all importing countries from a given exporting country i is related to the supply of the exporting country and will be captured by βhit. Using these fixed effects to capture supply and demand influences follows the recent work of Amiti et al (2024a,b).7
The crucial coefficient for us is θht – the coefficient on the geopolitical distance between trading partners Dijt. It provides an estimate of the effect of geopolitical distance on trade (volumes or prices). If countries shift trade from geopolitically distant countries to geopolitically close ones in a given period, we will see a negative θ for trade volumes. If the shift plays out over time, θ will remain in negative territory in subsequent periods as well. Similarly for prices: if exporters start to charge more to adversaries than allies, θ will be positive, and will remain positive over time if the gap continues to widen.
Our approach complements the existing literature. Much of the extant work relates trade to the size of the trading partners' economies and the geographical distance between them – the so-called gravity model – augmented by adding geopolitical distance measured in a similar way to us (eg Campos et al (2023), Cevik (2023), Gopinath et al (2024) and Hakobyan et al (2023)). Ours differs from that analysis in three ways. First, we focus on trade prices and volumes separately, instead of trade values. Second, we explicitly control for separate supply and demand influences at the sectoral level (instead of proxying supply and demand factors at the aggregate level using trading partners' GDP). Third, we analyse growth rates instead of trade levels to filter out the impact of time-invariant confounding factors such as geographical distance and cultural similarity.
Consistent with our discussion on conceptual drivers above, the impact of geopolitical distance on trade volume growth is generally negative: for the typical sector, the estimated θ associated with trade volume growth is below zero in nearly all periods (Graph 5.A, red line).8 Given the setup of our regression, this continual negative effect implies that the gap in trade volumes between geopolitically close and distant trading partners widened continuously over the length of our sample.9
The impact seems to be larger when trade policy uncertainty or geopolitical tensions are elevated. For example, the largest impact (in 2018) coincides with heightened trade policy uncertainty as US-China trade tensions flared. This is consistent with Jakubik and Ruta (2023), who find a shift from trading between adversaries to allies that is concentrated in uncertain times, as firms took precautionary actions given the unpredictable policy outlook. The effect remained negative, but less so, in subsequent years, especially during the Covid-19 crisis, but then grew again when geopolitical tensions surged after the Russian invasion of Ukraine. Somewhat surprisingly, the effect following the invasion is smaller than in 2018. This probably reflects the fact that trade reconfiguration due to geopolitical factors was already well under way before then.
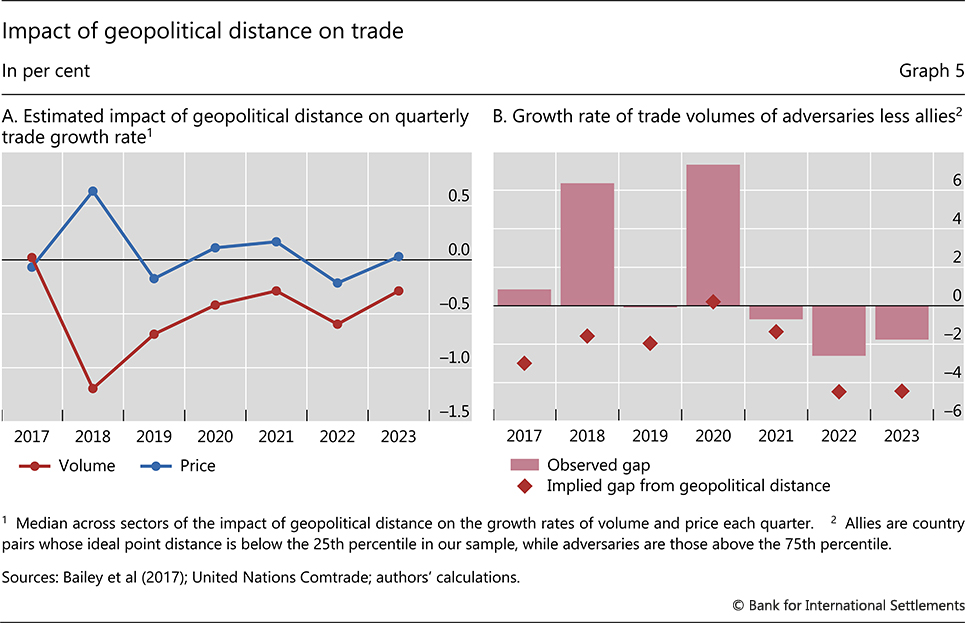
Overall, the impact of geopolitical distance on trade volume growth is sizeable. Throughout our sample, geopolitical factors dragged down the quarter-on-quarter growth rate of trade volumes among adversaries by around 2.5% relative to that among allies, on average (Graph 5.B, diamonds). After Russia's invasion of Ukraine, the implied gap widened to about –4%.
So what do we gain by controlling for demand and supply factors? If we did not, then we would just be comparing trade volumes between allies and adversaries. And that could lead us to very different conclusions. In fact, instead of an average effect of geopolitics of –2.5%, we would get +1.5% (Graph 5.B, bars). Over much of our sample, robust supply from China and/or strong demand from the United States were important contributors to global trade volume growth. To the extent that the growth was common across trading partners, our approach attributes this to supply and/or demand rather than geopolitics. Thus, given that both China and the United States are geopolitically far from many of their trading partners, if we did not control for supply and demand, it would materially distort our estimates of the effects of geopolitics.
The impact of geopolitical distance on export prices, in contrast, to that on trade volumes, has been smaller and has tended to fluctuate around zero (Graph 5.A, blue line). This partly reflects the ambiguous nature of the impact that trade barriers have on prices, as discussed previously. One episode that stands out is 2018, when trade prices among adversaries relative to allies increased. That would be consistent with a dominant effect from exporters exiting markets due to either tariffs making trade unprofitable or the imposition of quantitative restrictions.
Other studies that have addressed similar questions report an annualised difference in the value of trade between geopolitical allies and adversaries in the range of 4% to 22%.10 Our estimate, of around 10% annualised, is close to the middle of this range. But our methodology allows us to further decompose the change in the value and show that this is mostly explained by a change in trade volumes; trade prices, however, remained relatively static, demonstrating the benefits of our approach.
Risks to trade from geopolitical tensions
Our results highlight the potential risks that geopolitical tensions pose for trade. If political tensions were to intensify, this could result in stronger trade restrictions between geopolitical adversaries. As a result, the gap in trade volume growth between allies and adversaries would probably widen further. But the effects would be spread unevenly across countries.
We use our granular data of sectoral trade flows between country pairs to construct an assessment of these risks. We view bilateral trade flows from the perspective of each of the exporter and importer countries separately and provide a sense of their vulnerability.
The risk of individual countries to geopolitical tensions varies and is related to at least two factors.
For one, it depends on the extent to which a country may have to divert its trade. For imports, countries that source more goods from adversaries are at greater risk on this score, since trade with adversaries is more likely to be subject to new barriers. Similarly for exports – countries selling more to adversaries are more vulnerable. To proxy for the need to divert trade, we calculate a "need for diversion index" as the trade value-weighted average of the geopolitical distance between a country's trading partners in terms of each of its imports and exports.11
For another, it hinges on how easy it is for a country to divert its imports or exports to other countries. For example, if a country would like to divert its imports of a particular good, the options for doing so could be limited if suppliers are concentrated in a small number of countries, especially if those countries are geopolitical adversaries. Similarly, the ease of diverting exports would be limited if geopolitical adversaries dominate global demand. To gauge the flexibility of a country to divert trade for a given sector, we construct a measure of sectoral concentration for the sector that weights each potential trading partner by their geopolitical distance. We then aggregate these sectoral concentration measures, weighted by their trade share in imports or exports, to generate a country-level "impediment to diversion index".12
In interpreting our findings, some limitations must be borne in mind. For example, we have focused on risks associated with the composition of trade; for economies less dependent on trade, the macroeconomic costs of reductions in trade volumes will be smaller. In addition, the ease of substitutability may be poorly approximated by actual concentration at any given point in time, especially if infrastructure is essential to trade (eg pipelines for natural gas). Similarly, the criticality of a product for a country's economy is not considered.
For a given country, the risks to exports and imports will vary because of differing sectoral composition of trade flows and geopolitical distances to trading partners.
We assess individual countries' risk along these two dimensions, for exports (Graph 6.A) and imports (Graph 6.B) separately, using 2023 data. On the horizontal axis is our proxy for the need to divert trade, and on the vertical axis how difficult it is to do so. Countries further from the origin are those particularly at risk from further trade tension escalation.
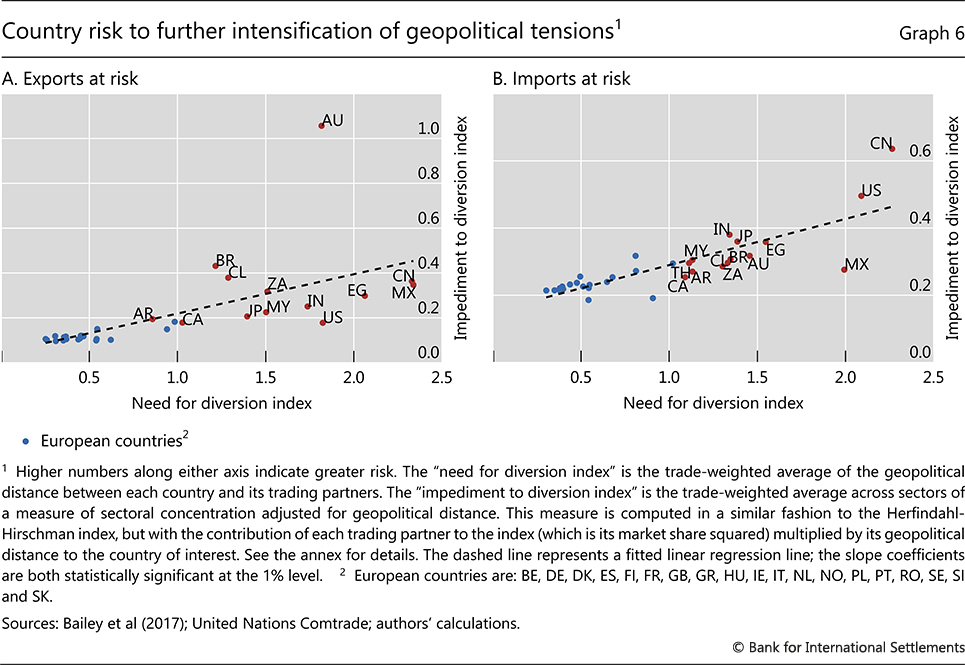
European countries in our sample appear to have the lowest risk for both exports and imports. First, they are geopolitically close to their major trading partners, with around 70% of their exports and imports being with other European countries,13 and second, they do not have a high share of sectors in which trade is dominated by their adversaries. The resilience partly reflects European countries' efforts to reorient their imports of strategic sectors and exports towards allies following Russia's invasion of Ukraine (Bosone et al (2024)). These countries would have been more vulnerable before 2023, considering their heavy reliance on Russia for energy imports.14
That said, our measures are limited by our data: a calculation of their resilience before 2022 would have understated the risks they faced, given the absence of Russia from our sample.
From the perspective of exports, a few countries are at notably higher risk than others. China and Mexico stand out based on the need to divert. This partly reflects the fact that, in both cases, their largest trading partner is the United States – a geopolitically distant country based on UN voting records. They both face a high "impediment to divert" as well, given that, in many of the sectors in which they export, geopolitically non-aligned countries are prominent importers. Australia is also vulnerable: while it is less geopolitically distant from its trading partners on average, some of its exports are in markets where geopolitical adversaries are outsize importers. In particular, Australia's largest export by value is iron ore, most of which is sold to China, the world's largest importer and a geopolitical adversary.
For imports, China, Mexico and the United States appear to be at the most risk. All three countries are heavily dependent on imports from countries that are geopolitically distant. Moreover, their adversaries dominate the global supply of imported goods across many sectors, limiting the potential to divert. For example, for China, the United States, Canada and Norway are all adversaries that play a significant role in supplying liquefied petroleum gases, a critical commodity.
Managing trade risks from geopolitical tensions is likely to be challenging. For both imports and exports, there is a statistically significant positive correlation between the need for diversion and the impediment to diversion (Graph 6, dashed line). This suggests that countries that are the most reliant on geopolitically distant trading partners have limited options to find alternative countries to trade with.
The risks discussed above can be mitigated in at least two ways, but with costs and limitations.
First, firms could seek to "de-risk" by reshoring – increasing reliance on domestic production, or friendshoring – sourcing from allies instead of adversaries (Cerdeiro et al (2024)).15 However, such a process is likely to take time. In addition, reshoring or friendshoring are likely to imply welfare losses due to less efficient use of labour and capital than under free trade. For example, Javorcik et al (2024) estimate that friendshoring may lead to losses to countries' real GDP of as much as 4.7%. Moreover, in some cases sourcing from alternative suppliers is not possible, as when trade patterns are driven by the availability of natural resources, for example trade in rare earths, lithium and uranium.
A second option could be for countries to adjust their political alignment. While we have taken geopolitical distances as a given in our analysis, high economic costs of diversion could incentivise a change in political choices of allies and adversaries. Kleinman et al (2020) finds that, as countries depend more on a trade partner, they tend to realign politically towards them. However, this process tends to play out only slowly, over decades.
Will some countries be able to benefit from trade reconfiguration due to geopolitics? It is possible that friendshoring may deliver a boon to certain countries' exports. Mexico and Vietnam, for instance, appear to have benefitted from US-China trade tensions. However, to the extent that the increase in their exports largely reflects the re-routing of existing trade, the real gains may be limited since the value added would be small. And the net benefits of trade diversion would be tempered by weaker demand from countries whose growth is adversely affected (Cerdeiro et al (2024)).
Conclusion
Our analysis suggests that global trade has become increasingly fragmented in recent years due to geopolitical tensions. We find evidence that countries that are more geopolitically distant tend to trade less with each other, all else equal. The risk this poses to individual countries varies: countries whose growth depends heavily on trade with geopolitical adversaries are especially vulnerable. This is not only because they face a greater need to divert their trade from current trading partners, but also because they may have more limited options to do so.
Going beyond the analysis in this feature, trade fragmentation is just one aspect of a more general pattern of international economic interactions being increasingly shaped by geopolitical considerations, sometimes referred to as "geoeconomic fragmentation" (Aiyar et al (2023)). In addition to trade, developments in investment and technology are also fragmenting. IMF (2023) shows that FDI flows are increasingly concentrated in geopolitically aligned countries, leaving some emerging market and developing economies especially vulnerable to capital relocation.
Geoeconomic fragmentation has implications for economic welfare. When geopolitical factors play a stronger role in economic decisions, this comes at the cost of a smaller role for comparative advantage and market efficiency. While some countries may come out winners from these changes individually, the world as a whole suffers as the gains from economic integration dwindle.
References
Aiyar, S, J Chen, C Ebeke, R Garcia-Saltos, T Gudmundsson, A Ilyina, A Kangur, T Kunaratskul, S Rodriguez, M Ruta, T Schulze, G Soderberg and J Trevino (2023): "Geo-economic fragmentation and the future of multilateralism", IMF Staff Discussion Note, no 1.
Amiti, M, O Itskhoki and D Weinstein (2024a): "Global supply chains and US import price inflation", Liberty Street Economics, 4 March.
--- (2024b): "What drives US import price inflation?", AEA Papers and Proceedings, vol 114, May, pp 106–11.
Bailey, M, A Strezhnev and E Voeten (2017): "Estimating dynamic state preferences from United Nations voting data", Journal of Conflict Resolution, vol 61, no 2, pp 430–56.
Blanga-Gubbay, M and S Rubínová (2023): "Is the global economy fragmenting?", WTO Staff Working Paper, no ERSD-2023-10.
BIS (2024): "China as a disinflationary force", Annual Economic Report 2024, pp 6–7.
Bosone, C, E Dautović, M Fidora and G Stamato (2024): "How geopolitics is changing trade", ECB Economic Bulletin, issue 2, Box 2.
Caldara, D and M Iacoviello (2022): "Measuring geopolitical risk", American Economic Review, vol 112, issue 4, pp 1194–225.
Campos, R, J Estefanía-Flores, D Furceri and J Timini (2023): "Geopolitical fragmentation and trade", Journal of Comparative Economics, vol 51, no 4, pp 1289–315.
Cerdeiro, D, P Kamali, S Kothari and D Muir (2024): "The price of de-risking: reshoring, friend-shoring, and quality downgrading", IMF Working Papers, no 122.
Cevik, S (2023): "Long live globalization: geopolitical shocks and international trade", IMF Working Papers, no 2023/225.
Gopinath, G, P Gourinchas, A Presbitero and P Topalova (2024): "Changing global linkages: a new cold war?", IMF Working Papers, no 2024/76.
Hakobyan, S, S Meleshchuk and R Zymek (2023): "Divided we fall: differential exposure to geopolitical fragmentation in trade", IMF Working Papers, no 2023/270.
International Monetary Fund (IMF) (2023): "Geoeconomic fragmentation and foreign direct investment", World Economic Outlook, Chapter 4, pp 91–114
Jakubik, A and M Ruta (2023): "Trading with friends in uncertain times", Journal of Policy Modeling, vol 45, pp 768–80.
Javorcik, B, L Kitzmueller, H Schweiger and M Yıldırım (2024): "Economic costs of friendshoring", The World Economy, vol 47, no 7, pp 2871–908.
Jiao, Y, Z Liu, Z Tian and X Wang (2022): "The impacts of the US trade war on Chinese exporters", Review of Economics and Statistics, pp 1–34.
Kleinman, B, E Liu and S Redding (2020): "International friends and enemies," NBER Working Paper, no 27587.
Qiu, H, H S Shin and L Zhang (2023): "Mapping the realignment of global value chains", BIS Bulletin, no 78, October.
Annex
Measuring risks to trade from geopolitical tensions
This annex describes two indices to measure the risk of a country's trade due to geopolitics. These can be applied to a country's exports and imports separately, to get a sense of the riskiness of each. For illustration, we focus on the risk to a country's exports.
The first index, Ni , is the need for trade diversion of country i. This is the weighted sum across all sectors (h) and all exporting partners (j) of their geopolitical distance (Dij), where the weights are shares of the total value of country i's exports:
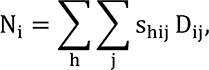
where 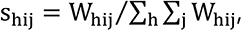 , and
, and  is the value of trade in sector h from country i to country j.
The second index, Ii, is the impediment to diversion for country i. This is a measure of the concentration of trade across importing countries by sector, but where the contribution of each country j's trade to the index is weighted by its geopolitical distance to country i.
Each importing country's contribution to the concentration index in a given sector,  , is given by the square of that country's share of total trade value in that sector, analogous to a sectoral Herfindahl-Hirschman index:
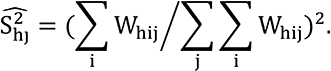
To construct Ii, each of these is weighted by the geopolitical distance between the two countries (Dij), with this sum then aggregated to the country level based on sector h's share of country i's total exports:
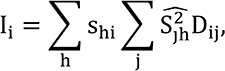
where 
1 We thank Ryan Banerjee, Claudio Borio, Julián Caballero, Gaston Gelos, Tirupam Goel, Marco Lombardi, Benoît Mojon, Frank Packer, Goetz von Peter, Andreas Schrimpf, Hyun Song Shin and Philip Wooldridge for helpful comments and suggestions. We are also grateful to Luca Iavarone, Berenice Martínez and Jimmy Shek for excellent research assistance. The views expressed are ours and do not necessarily reflect those of the Bank for International Settlements.
2 Commonly called "free on board" prices, excluding any levied tariffs.
3 Qiu et al (2023) documented the lengthening of supply chains on the back of re-routing of trade through third-party countries.
4 For example, Jiao et al (2022) find that US tariffs in 2018 had little effect on the free-on-board price of China's exports due to exporters' already compressed profit margins.
5 Our country sample consists of Argentina, Australia, Belgium, Brazil, Canada, Chile, China, Denmark, Egypt, Finland, France, Germany, Greece, Hungary, India, Ireland, Italy, Japan, Malaysia, Mexico, the Netherlands, Norway, Poland, Portugal, Romania, Slovakia, Slovenia, South Africa, Spain, Sweden, the United Kingdom and the United States.
6 The geopolitical distance data are available only until 2022. We assume that the value for 2023 is the same as for 2022 in our analysis.
7 Amiti et al (2024a,b) focus on the price of imports to the US. BIS (2024) uses the same approach to assess the effect of China's exports on imported inflation across a panel of 12 countries.
8 There is a lot of heterogeneity in the estimated θ across different sectors, with around half of them being statistically insignificant. Following Amiti et al (2024a,b), we include both significant and insignificant estimates in our analysis.
9 This is similar to the finding that the impact of geopolitical distance on foreign direct investment (FDI) has increased over the last decade (IMF (2023)).
10 Most existing results are based on comparing trade within and between different geopolitical blocs. For example, Gopinath et al (2024) found that after Russia's invasion of Ukraine, trade between hypothetical western and eastern blocs – as in our case, identified from UN voting patterns – declined by 12% more than intra-bloc trade, while Blanga-Gubbay and Rubínová (2023) observed a 4% gap. Meanwhile, Campos et al (2023) estimated that fragmentation into western, eastern and neutral blocs could see trade flows drop by 22% in their base scenario, or up to 57% in an extreme one.
11 IMF (2023) uses a metric analogous to our "need for diversion index" to measure individual countries' risk from geopolitical tensions to FDI flows.
12 Our "impediment to diversion index" requires sectoral data and has not been used before. It is a country-specific measure of sectoral concentration (similar to the Herfindahl-Hirschman Index), adjusted for geopolitical distance. See the annex for details.
13 This, of course, means that the level of aggregation matters. For instance, if we treated the European Union or euro area as a single entity, their vulnerability would look higher.
14 Note that our calculation of their resilience before 2022 would have further understated the risks most European countries faced given the absence of Russia from our sample.
15 Re-routing trade via third countries can also help to circumvent trade barriers, but this option could trigger further trade restrictions, the more so if it becomes popular.