Markets adjust to "higher for longer"

Markets oscillated as monetary policy interest rate hikes appeared to be coming to an end. Long-term yields surged and then retreated on investors' evolving perceptions of future policy actions.1 After reaching highs in some cases not seen since the run-up to the Great Financial Crisis (GFC), yields declined rapidly in November. Developments in risky asset markets, as well as exchange rates and capital flows in emerging market economies (EMEs), were closely intertwined with the evolution of core bond markets.
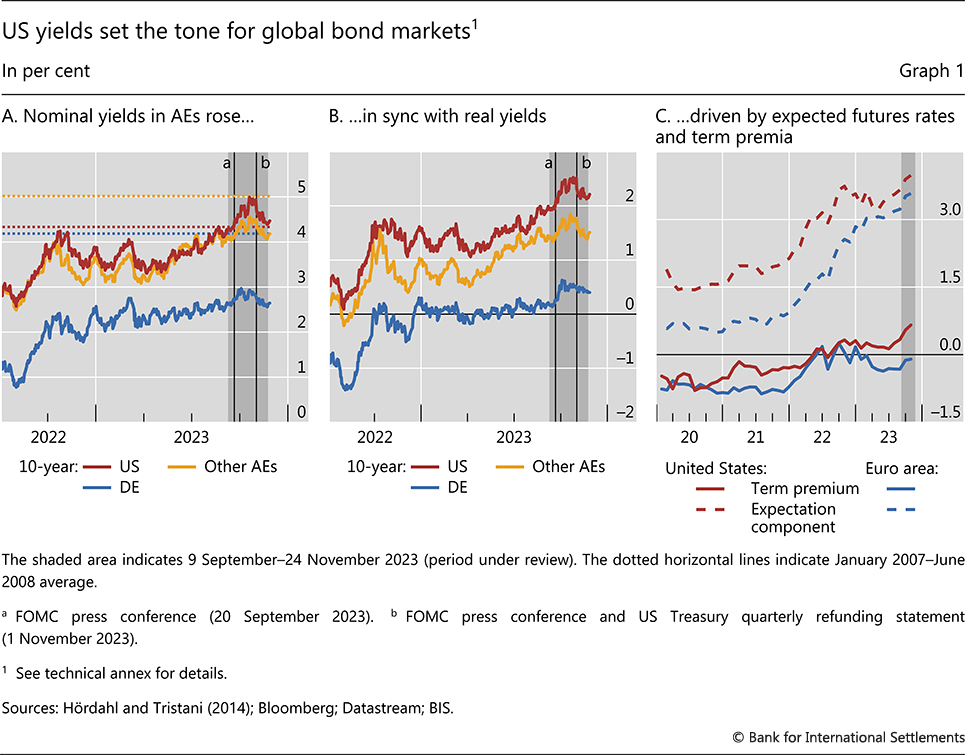
The path of long-term yields reflected market participants' strong reactions to statements by public authorities and news about the economic outlook. With inflation slowing, nominal and real yields followed similar paths in major advanced economies (AEs). Long-term yields started the review period under upward pressure from rising term premia, amid expectations of an increased supply of long-term debt, as announced earlier by the US Treasury. The rise in yields accelerated following the September Federal Open Market Committee (FOMC) meeting, as investors began to expect policy rates to stay high for longer than previously anticipated. Fixed income markets reversed course in November, when investors interpreted central bank communication and macroeconomic data releases as suggesting an earlier end to the hiking cycle. In addition, pressures on term premia eased on announcements of lower than expected issuance of long-dated Treasuries. Long-term yields in Japan reached highs not seen in a decade, with the central bank further relaxing its yield curve control (YCC) policy and the yen briefly depreciating to its lowest level since 1990. Bond spreads temporarily widened within the euro area on country-specific fiscal concerns.
Developments in risky asset markets were closely linked with those in fixed income markets. Stock prices declined for most of the review period and then rallied in November, in tandem with those of government bonds. The correlation between equity and government bond returns has remained positive since inflation took hold in 2021, thus weakening investor demand for bonds as a hedge and contributing to higher yields. Credit market conditions continued to be relatively benign, although credit spreads did widen temporarily. Fairly compressed credit spreads reflected relatively subdued corporate debt issuance, solid balance sheets for many corporates and possible lags in the transmission from higher policy rates to debt service burdens. Banks kept lending standards tight amid a pickup in default rates, while loan demand remained weak, especially in the euro area.
Emerging market economy (EME) financial markets continued to grapple with high US yields and the prospect of accelerating capital outflows, before getting some respite in November. Long-term local currency government bond yields increased, albeit less than in the United States, with term premia edging up, particularly in Latin America. EME portfolio flows were mostly negative, both in Asian and Latin American funds. While some EME currencies went through a short bout of depreciation against the US dollar, most ended up flat on net over the review period.
Key takeaways
- Bond markets remained volatile, with yields oscillating on evolving investor perceptions of the future path of policy interest rates; announcements of sovereign debt issuance also played a role.
- Risky asset markets lost ground before recovering, following the path set by bond yields, while conditions in credit markets remained benign.
- EME financial markets grappled with swings in US yields and changing pressures on domestic currencies. Portfolio outflows continued, reflecting a divergence in expected interest rate paths.
US yields continued to set the tone for global bond markets
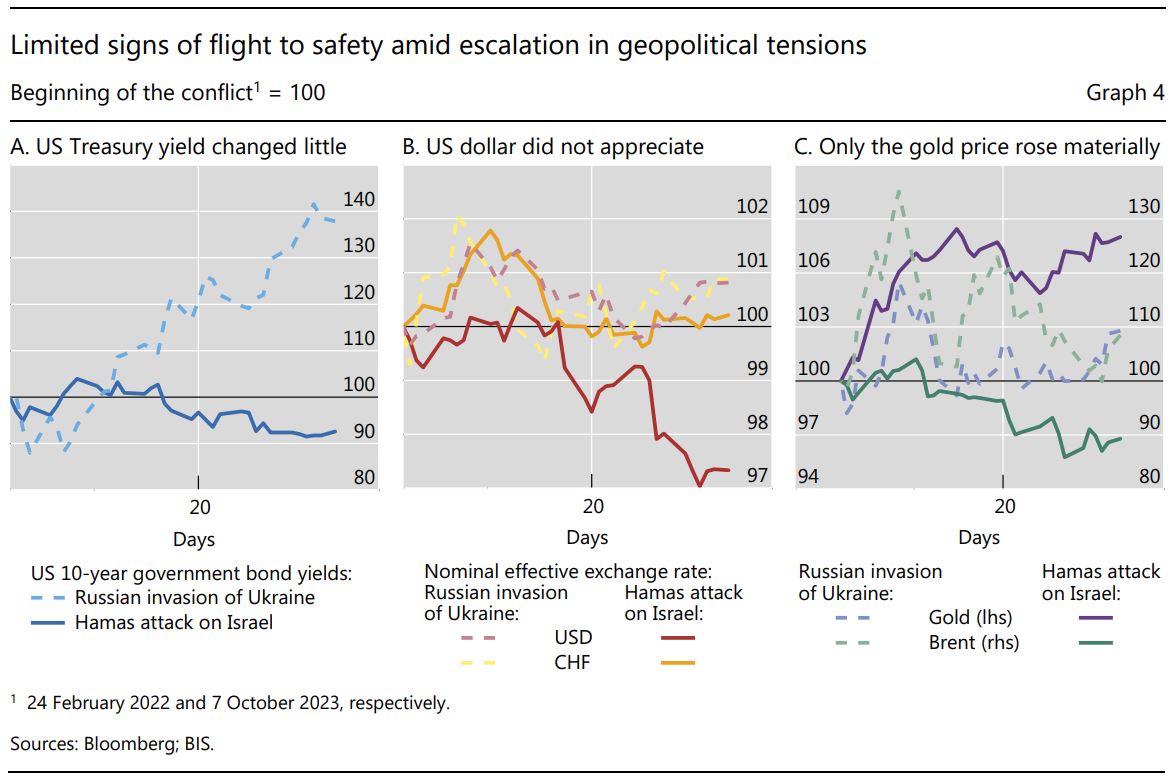
During the review period, developments in fixed income markets were underpinned by expectations of policy rate paths and sovereign debt issuance amid large fiscal deficits. The Federal Reserve and the ECB put policy rates on hold while reiterating their commitment to bring inflation back to target and re-affirming that rates may have to stay at higher levels than previously anticipated. Fixed income markets were volatile on the back of market participants' heightened sensitivity to central bank communications and macro news. Against the background of what they perceived to be data-dependent monetary policy, market participants kept revising their expectations, with yields rising through October and then declining in November. The effects of the outbreak of the war in the Middle East in early October were short-lived, and a flight to safety did not materialise.
By late October, yields on 10-year government bonds in major AEs reached levels not seen in more than a decade, and in some cases not since the run-up to the GFC. The rise in long-term yields accelerated following the 20 September FOMC meeting (Graph 1.A, line a), as market participants came to expect that policy rates would stay high for longer. With inflation receding, the paths of long-term government bond yields closely mirrored movements in inflation-adjusted, ie real, yields (Graph 1.B). In parallel, estimates of both the expectations and the term premium components of yields kept rising (Graph 1.C).2 Estimates of the term premium began rising back in August, when the US Treasury surprised market participants with plans for a large increase in the supply of long-maturity securities.
Bond yields retreated in November, as investors revised down their expectations of future rate paths and pressures on term premia eased. Investors were reassured by the 1 November FOMC press statement (Graph 1.A, line b), which suggested that tighter financial conditions made further policy rate hikes less likely. And the US Treasury surprised market participants again, this time by announcing a lower than expected increase in issuance of long-term debt. Yields kept falling through November, as a string of macroeconomic data releases pointed to softer activity and faster than expected disinflation progress, lending further support to investors' revised perceptions of the future path of policy rates. Similar support came from the release of the November FOMC minutes. In Europe, even though the ECB communications kept stressing that the fight against inflation was not over, markets still priced in rate cuts as early as the second quarter of 2024 amid weak growth outlook in the euro area.
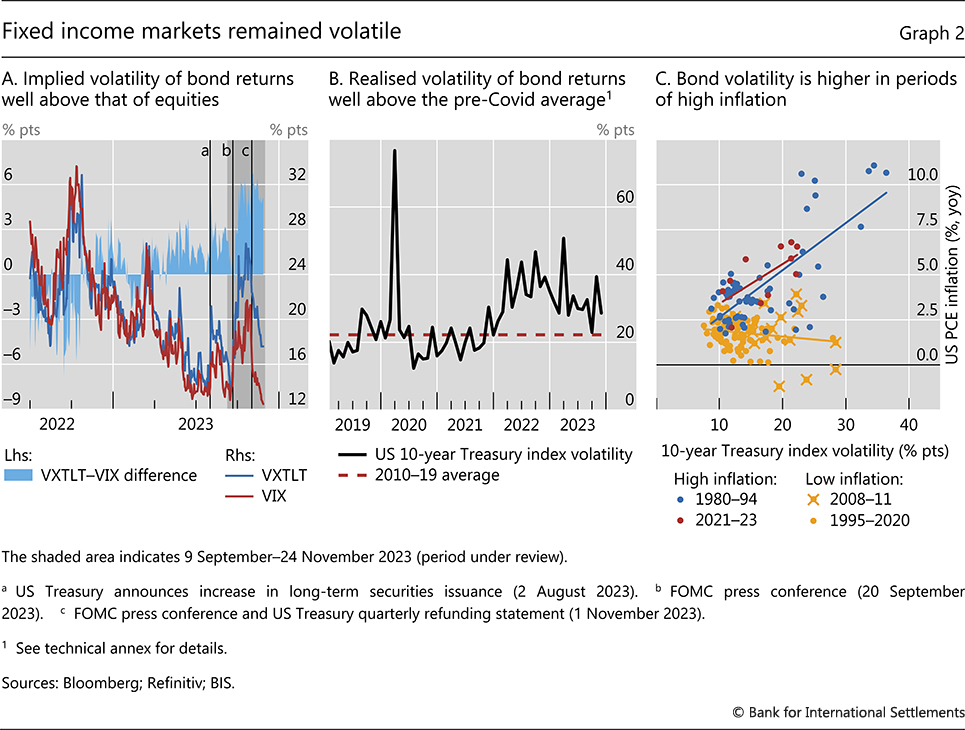
Volatility remained elevated amid rapidly changing conditions in fixed income markets. The option-implied gauge of US government bond return volatility increased after the September FOMC meeting, surpassing that of stock returns (Graph 2.A), although both metrics subsequently declined in November. The spike in volatility reflected the sensitivity of fixed income markets to US monetary and macro news.
Since high inflation took hold in mid-2021, the realised volatility of US government bond returns has hovered well above its average during the pre-pandemic decade of low inflation (Graph 2.B). When inflation surprises from a low level, it rarely prompts reassessments of possible monetary policy responses and, as a result, the volatility of bond returns does not co-move systematically with it (Graph 2.C, yellow dots and crosses). This changes at high levels of inflation: the bond volatility and inflation surprises were positively correlated in the recent period (red dots), similar to the 1980–94 period (blue dots). The co-movement is stronger when inflation surprises on the upside, as the resulting decline in bond prices tends to raise volatility by more.3
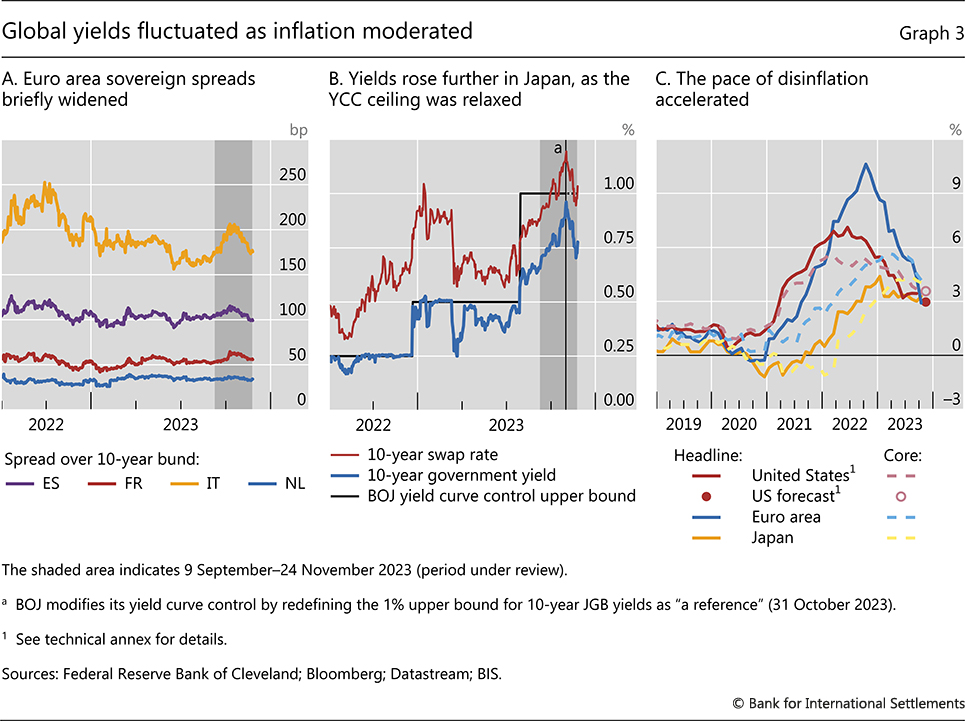
In some euro area economies, fiscal concerns pushed up government bond yields further. On the back of rising budget deficits, spreads of Spanish and especially Italian sovereign bonds over German bunds widened by up to 40 basis points during the review period (Graph 3.A). The Italian sovereign spread once again exceeded 200 basis points in October before compressing in November, amid the broad-based fall in government bond yields and as a major ratings agency reported an improvement to Italy's sovereign ratings outlook.
Japanese government bond (JGB) yields temporarily surged due to both domestic and external factors, reaching levels not seen in over a decade (Graph 3.B). This prompted the Bank of Japan to conduct an unscheduled bond operation in October to smooth market functioning. Part of the pressure on benchmark 10-year JGB yields came from higher expected future rates amid inflationary pressures (Graph 3.C). Domestic core CPI had exceeded the central bank's inflation target for sufficiently long to lead market participants to expect monetary policy tightening in the near future. Still, the YCC policy imposed limits on the 10-year yield, which led the yen to depreciate to multi-decade lows on widening yield differentials with US Treasuries. Following its late October monetary policy meeting, the Bank of Japan relaxed the YCC policy further, and revised upwards its inflation forecasts. In November, the yields on JGBs declined on reduced external pressures.
The immediate market reaction to the escalation in geopolitical tensions in the Middle East was muted and short-lived. There were few, if any, discernible signs of a flight to safety. Following the 7 October attack by Hamas, US Treasury yields hardly moved, unlike in 2022, when Russia invaded Ukraine (Graph 4.A). Similarly, the US dollar did not significantly appreciate (Graph 4.B), although the Swiss franc, another safe haven currency, did appreciate for about two weeks. Among commodities, oil prices did not react and only gold prices rose substantially and remained persistently higher (Graph 4.C).
Risky asset markets tied to the rates outlook
Prices of risky assets were closely tied to developments in fixed income markets, in particular to expectations about future rates. Both equity and credit market prices declined in the first part of the review period, only to recoup losses in November. Conditions in credit markets remained relatively benign, although credit spreads widened temporarily. Bank lending standards continued to tighten, especially in Europe.
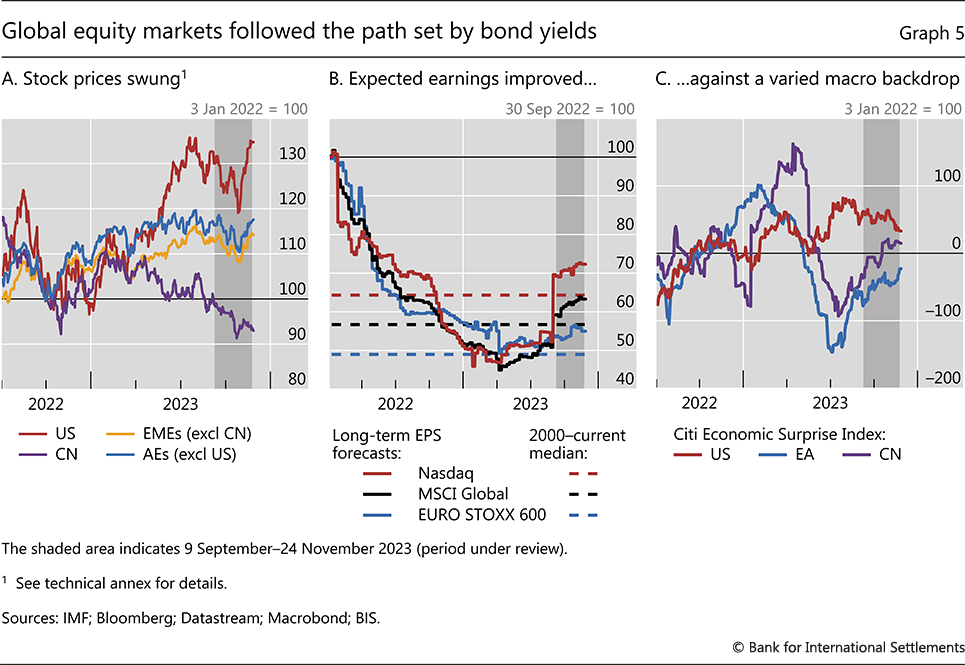
Stock indices declined across the board early in the review period, in some cases losing more than 10% since their summer highs. The reasons differed across regions. In the United States, the enthusiasm that characterised some tech stocks earlier in the year fizzled out, and even the tech-heavy Nasdaq index posted losses (Graph 5.A). More broadly, higher discount rates weighed on US equity valuations, even as expected earnings per share actually rose (Graph 5.B) amid positive macroeconomic surprises on balance (Graph 5.C). In Europe, disappointing macroeconomic data (blue line) helped explain the negative price action. However, equity markets rapidly recouped losses in November when investors judged that the likelihood of additional rate rises had diminished significantly. Such an environment – in which bad news for the economy were interpreted in relation to the implications for monetary policy – reinforced the positive correlation between stock and sovereign bond returns. A positive correlation between these key asset classes may, in turn, adversely affect investors' risk diversification opportunities (Box A).
Credit spreads remained compressed, despite the high level of yields. Spreads temporarily ticked up during the review period, and in the euro area were above their historical averages, both for investment grade and the high-yield segment (Graph 6.A). Still, even with their modest widening, credit spreads remained tight given the high level of corporate yields (Graph 6.B). This behaviour, visible in both the United States and the euro area, is uncharacteristic of the past decade and was last observed during the 2004–06 monetary policy tightening cycle (Graph 6.C).
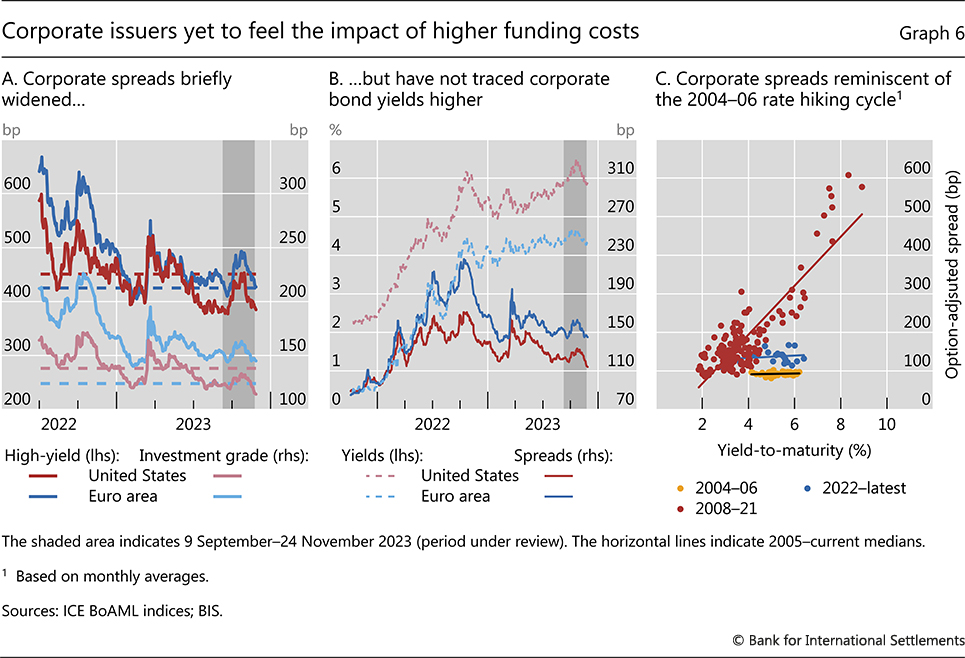
At least two factors may explain why credit spreads have not widened materially despite rising corporate funding costs. First, many corporates termed out their debt issuance profile in recent years and appear to still have large cash buffers (raised when interest rates were lower). This has allowed them to avoid refinancing at the current high borrowing rates (Graph 7.A). Second, the rise in corporate bond yields has coincided with an increase in the earnings outlook, a combination that has an ambiguous net effect on creditworthiness and, thus, credit spreads.
Nonetheless, tensions in corporate credit markets may lie ahead. A substantial amount of debt will become due in the next few years and will need to be refinanced at significantly higher rates. Small corporates are particularly vulnerable to such a scenario (Box B). The actual refinancing costs could increase further if credit spreads widen during a refinancing wave.
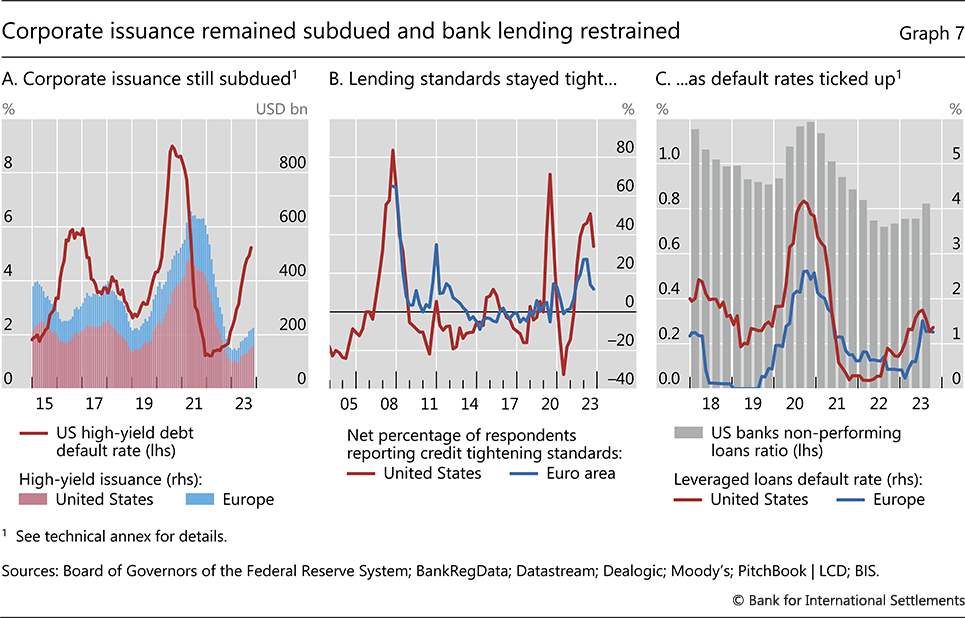
Bank lending remained subdued because of both supply and demand factors. Banks continued to extend credit with caution, keeping lending standards tight in both the United States and euro area (Graph 7.B). According to market sources, rising credit losses and funding pressures were recurring topics at recent earnings calls.4 Indeed, the non-performing loan ratios of US banks ticked up in the third quarter (Graph 7.C), particularly for commercial real estate, credit cards and auto loans. At the same time, default rates on leveraged loans in both the United States and the euro area moderated. In addition, loan demand fell in both the United States and the euro area alike: 60% of US banks cited weaker demand for home mortgages in the third quarter, up from 43% in the previous quarter.
EMEs feel the effects of global conditions
Developments in EME financial markets were closely intertwined with the global environment. Portfolio outflows continued for most of the review period, exerting pressure on local currencies, bond and equity markets. In China, macroeconomic conditions remained fragile, with positive and negative macroeconomic surprises alternating. Similar to AEs, November brought some respite across EMEs, as US long-term yields declined and the US dollar depreciated.
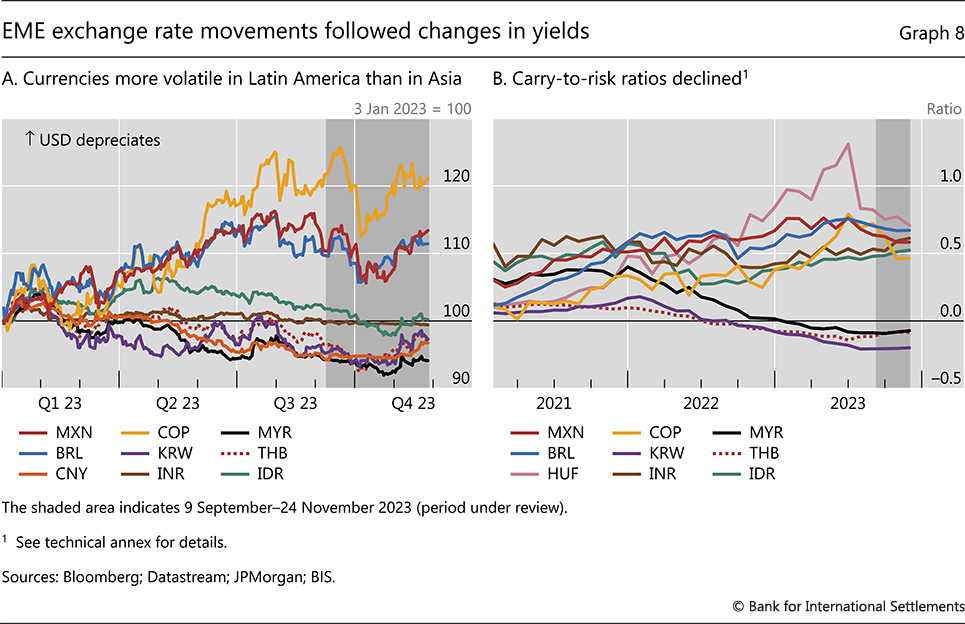
EME currencies ended the review period broadly unchanged against the US dollar, but differed from each other in terms of the path they followed. Latin American currencies depreciated substantially in September and October (Graph 8.A), reflecting expectations of rate cuts and rising US yields. They recovered in November amid a robust domestic macro outlook and a rapid decline in US yields. Incentives for carry trades partly explain these exchange rate movements, as Latin America had received substantial inflows earlier in the year, but carry-to-risk ratios subsequently declined (Graph 8.B), prompting some outflows. Asian currencies, by contrast, were much more stable throughout, in part also due to foreign exchange interventions by central banks in the region (see below).
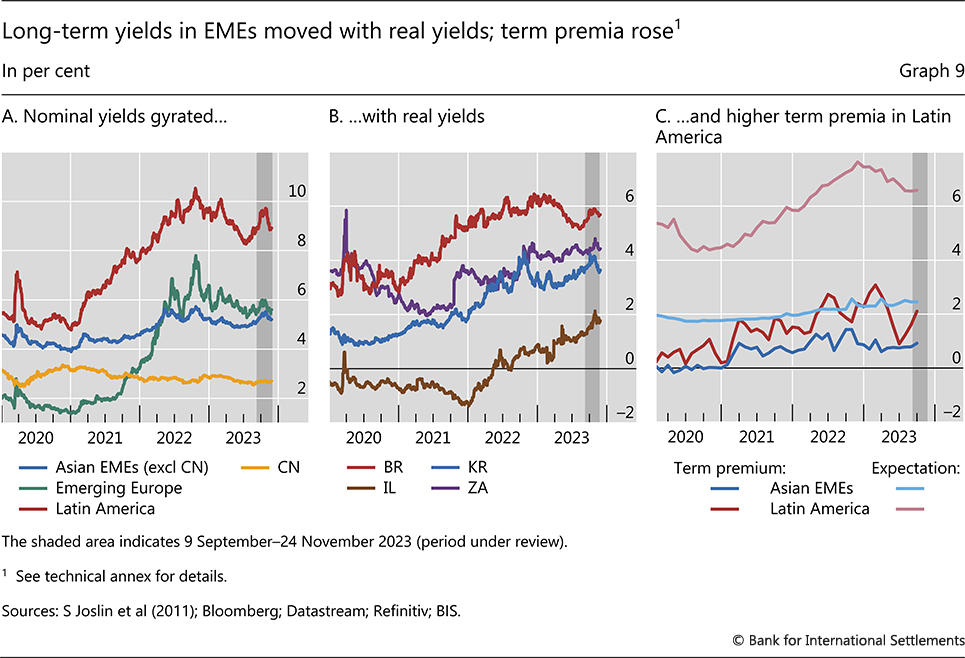
Sovereign bond yields in a number of EMEs rose amid investor selling pressures and then declined. Yields on 10-year government bonds increased substantially in Latin America, and to a lesser extent in European and Asian EMEs before recovering some ground in November (Graph 9.A). Brazil also saw an increase in real yields, despite renewed policy rate cuts (Graph 9.B). Estimates of term premia widened in Latin America more generally (Graph 9.C), as investor demand for local currency bonds decreased.
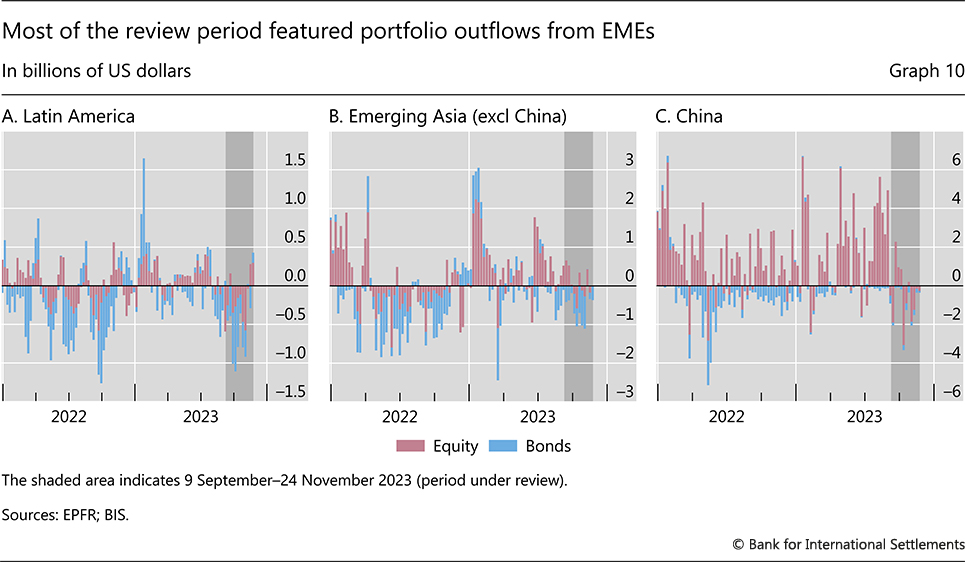
Fund flow data suggested that foreign investors' appetite for EME risk diminished. Portfolio outflows accelerated for most of the review period but have recently moderated in Asia and reversed in Latin America. Outflows in Latin America affected both bond and equity funds (Graph 10.A) continuing a trend since the summer. In Asia, outflows were concentrated in bond funds reflecting lower local yields than in the United States and other AEs (Graph 10.B).
Foreign investor retrenchment from China went hand in hand with the country's changing macroeconomic news. As positive surprises early and late in the review period were not sufficient to reassure investors, outflows from both bond and equity funds featured throughout the review period (Graph 10.C). Amid a generally weak growth outlook, local currency bond yields remained significantly below those in other major economies, as the central bank continued to stimulate the economy.
EME authorities have been actively managing exchange rate pressures. Some central banks reportedly intervened in FX markets, as suggested by declining FX reserves, to contain effects on local currencies. Others raised policy rates to help preserve external stability, notwithstanding a benign domestic inflation outlook. Authorities in a number of EME jurisdictions have drawn from a broad policy toolkit that includes interventions in currency spot, derivatives and local bond markets.
Some EME central banks have been adding to or adjusting the set of tools they use. For example, Bank Indonesia started issuing securities with interest rates linked to US dollar rates to attract foreign investors and replenish foreign exchange reserves. In turn, the Bank of Mexico has reduced the size of its foreign exchange hedging programme, as conditions on the peso-dollar market stabilised.
Technical annex
Graph 1.A and 1.B: Other AEs based on simple average of AU, CA and GB.
Graph 1.C: Ten-year maturity. Monthly data up to end-October 2023. Estimates based on the joint macroeconomic and term structure model of P Hördahl and O Tristani, "Inflation risk premia in the euro area and the United States", International Journal of Central Banking, vol 10, no 3, September 2014.
Graph 2.B: Computed as the annualised monthly sum of daily squared returns on the Refinitiv 10-year government benchmark index. The monthly volatility for November 2023 was computed using data up to 24 November.
Graph 3.C: PCE for headline and PCE excluding food and energy for core. Forecasts from Cleveland Fed NowCast.
Graph 5.A: US = Nasdaq composite index; CN = Shanghai Shenzhen CSI 300 index. Country group aggregates based on GDP-weighted averages.
Graph 7.A: US high-yield default rate based on Moody's 12-month rolling US speculative grade default rates. High-yield issuance based on a 12-month rolling sum.
Graph 7.C: Twelve-month rolling leveraged loan default rates based, respectively, on Morningstar LSTA US Leveraged Loan Index (LLI) and Morningstar European Leveraged Loan Index (ELLI).
Graph 8.B: One-month interest rate differential divided by the implied volatility of one-month at-the-money currency options.
Graph 9.A: Ten-year maturity. Asian EMEs (excl CN) = simple average of ID, IN, MY and TH; emerging Europe = simple average of CZ, HU, PL, RO and SK; Latin America = simple average of BR, CL, CO, MX and PE.
Graph 9.B: Ten-year maturity.
Graph 9.C: Estimates based on the term structure model of S Joslin, K Singleton and H Zhu, "A new perspective on Gaussian dynamic term structure models", Review of Financial Studies, vol 24, no 3, 2011. Regional unweighted averages of estimated term premia and expectations components, estimated using zero coupon local currency bond yields for each market. Other AEs: AU, CA, CH, GB and SE; Asian EMEs: HK, ID, IN, KR, SG and TH; Latin America: BR, CL, CO, MX and PE.
1 The period under review is from 9 September through 24 November 2023.
2 The term premium is the excess return that investors demand for holding long-term bonds over short-term bonds. Estimates of term premia require the path of expected short-term rates to be stripped out from bond yields. Since the former are not unobservable, term premia are estimated with different econometric approaches. Some approaches rely only on the observed yield curve and model it through a set of common factors; others also include surveys and macroeconomic data. Results vary according to the different modelling assumptions, but a feature they all share is the wide uncertainty around the estimates. Still, different methods broadly agree that term premia have increased in recent months. For a review of methods and modes, see B Cohen, P Hördahl and D Xia, "Term premia: models and some stylised facts", BIS Quarterly Review, September 2018, pp 79–91.
3 Inflation news also has a mechanical effect on bond prices: when the principal and coupons of outstanding bonds are fixed in nominal terms, a rise in inflation erodes bonds' real value.
4 For persistent headwinds in the life insurance sector, see Box C.