Non-financial corporates' balance sheets and monetary policy tightening
Box extracted from Overview chapter "Resilient risk-taking in financial markets"
The recent weak growth in credit to non-financial corporates reflects both supply and demand factors, as illustrated in the main text.* The supply factors include higher interest rates and overall tighter lending standards. Demand factors include a weakening economic outlook, not least due to tighter monetary policy. In addition, the circumstances preceding the ongoing tightening cycle also helped non-financial corporates (NFCs) build liquidity buffers and, more generally, strengthen their balance sheets. This box documents a decline in debt service burdens since the start of the current tightening episode and argues that this development is exceptional and due to NFCs' pre-positioning during the low interest rate era. It also documents a recent worsening of NFCs' balance sheets and a looming rise in debt refinancing needs at higher interest rates.
There are stark differences between the last pre-GFC tightening episode (2004–07) and the current one in terms of NFC debt-to-GDP and debt service ratios (DSRs). A cross-country analysis suggests that NFC debt-to-GDP and DSRs were flat or even declining prior to the pre-GFC tightening cycle and then steadily increased (Graph B1.A and B1.B, red dots). By contrast, the current tightening episode (blue dots) displays a different pattern: debt-to-GDP and DSRs were increasing before the tightening started, reflecting the effects of the pandemic and the forceful policy response. These ratios subsequently declined, notwithstanding the substantial monetary policy tightening that has been deployed so far.
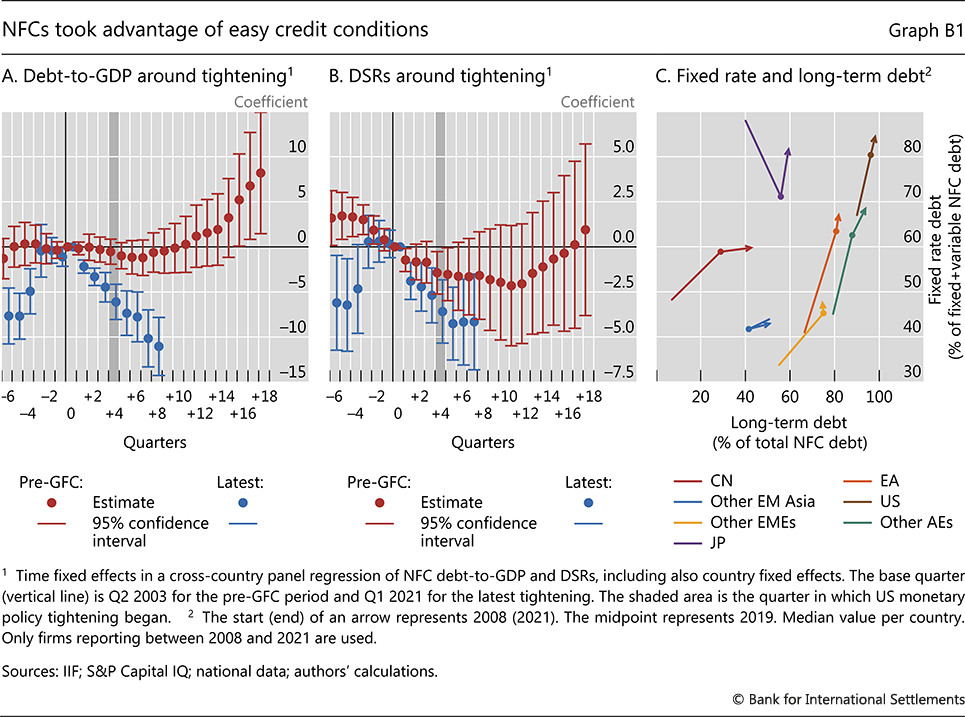
One explanation of these diverging experiences stems from different inflation dynamics in the two episodes. Before the pre-GFC tightening cycle, inflation had been rising gradually and peaked at a very moderate level. By contrast, the current tightening occurred in the wake of an exceptionally swift rebound in economic activity due to the post-pandemic reopening and an unexpected surge of inflation to levels last seen in the 1980s. Thus, while NFCs' nominal revenues increased moderately in the earlier episode, they have surged recently. While such developments would typically reduce the real value of NFCs' debt burden, all else the same, the ultimate effect depends on the evolution of debt payments.
This underscores the importance of a second distinctive feature of the current episode: the initial composition of NFC debt. In the pre-GFC episode, NFCs' balance sheets featured mostly debt at short maturities and variable rates. As a result, the policy tightening at that time led to a steady and progressive increase in borrowing costs, which overwhelmed the modest increase in nominal revenues, driving the rise in the debt-to-GDP ratio and the DSR. Before the current tightening, by contrast, NFCs took on more debt at long maturities and at fixed rates, benefiting from low interest rates, generous fiscal support packages and easy credit conditions in the wake of the Covid-19 pandemic. To be sure, this process had already started in some jurisdictions during the low-rate period that followed the Great Financial Crisis (Graph B1.C). When the pandemic broke out, the process continued and even intensified for many NFCs. Against this backdrop, NFCs' debt payments have stayed roughly stable despite the ongoing tightening, which – together with the effect of inflation on revenues – depressed the real value of NFCs' debt burden.
Between the pandemic and the start of the tightening cycle, firms not only secured funding at favourable conditions, but also actively strengthened their balance sheets with hefty liquidity buffers. Somewhat paradoxically, this was also facilitated by the increased uncertainty brought about by the pandemic, which prompted firms to postpone investment and use instead the cheap funding secured to acquire liquid assets. Graphs B2.A and B2.B portray this development for NFCs in AEs and EMEs between Q3 2020 and Q1 2022. Relative to initial levels, there were material declines in leverage and in the share of interest expense in total expenses, and a similar increase in the ratio of short-term assets over short-term liabilities (diamonds vs red boxes).
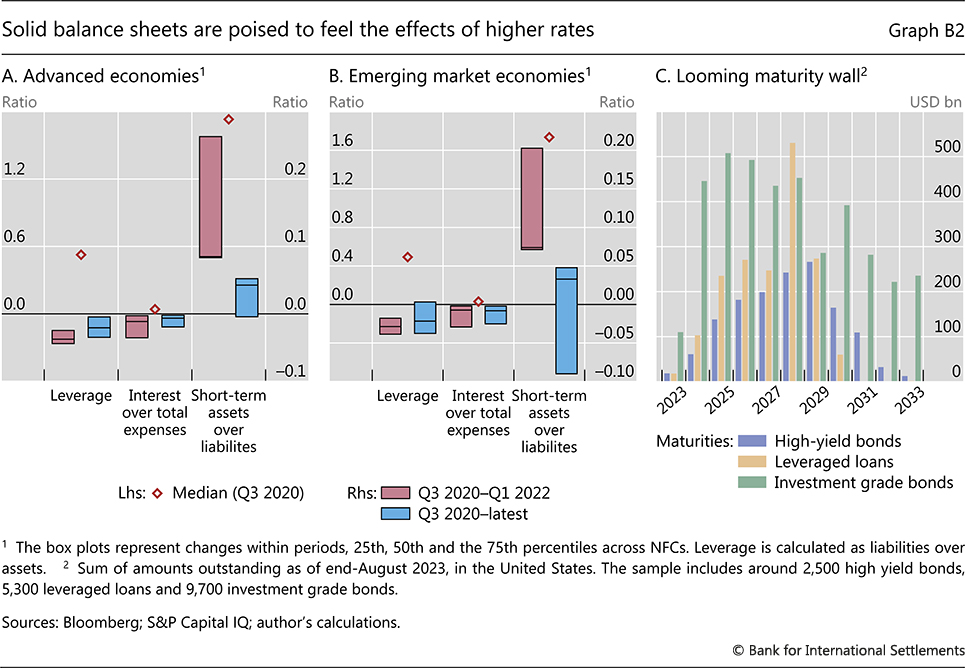
Eventually, NFCs' pre-positioning in the run-up to the current tightening will run its course as a shield against the effect of higher interest rates. Indeed, balance sheets have deteriorated somewhat since the start of the current tightening cycle, as cash balances decreased and new debt was rolled over at higher rates against the backdrop of steadily tightening monetary policy (Graphs B2.A and B2.B, blue boxes). In addition, borrowing demand seems poised to rise, as a significant portion of outstanding debt will mature in three to six years (Graph B2.C). To the extent that NFCs roll their debt over, they will do so at higher interest rates, which will eventually increase the burden of tightening on their balance sheets.
* The views expressed are those of the authors and do not necessarily reflect the views of the BIS.