II. Monetary policy in the 21st century: lessons learned and challenges ahead
- Chapter II: Data behind the graphs
- Press release: Price stability and fiscal consolidation are key foundations of future prosperity: BIS
Key takeaways
- Since the turn of the 21st century, a series of extraordinary events – major financial crises, a pandemic and an unexpected surge in inflation – have profoundly shaped the conduct of monetary policy.
- This tumultuous experience points to several lessons regarding what monetary policy can and cannot deliver. They concern the ability to control runaway inflation, the power to stabilise the financial system at times of crises, the limits to forceful and prolonged monetary easing, the growing complexity of communication, and the complementary role of foreign exchange (FX) intervention and macroprudential policies.
- The lessons point to a number of key considerations that could guide monetary policy in the years ahead. These stress the importance of robustness, realism in ambition, safety margins and nimbleness. Coherence across policy domains is essential to ensure the lasting achievement of macroeconomic and financial stability.
Introduction
Since the turn of the 21st century, a series of extraordinary events have severely tested the conduct of monetary policy. The Great Financial Crisis (GFC) and the subsequent sovereign debt crisis in the euro area shattered the deceptive tranquillity of the so-called Great Moderation – the decades-long phase of low output and inflation volatility enjoyed by most advanced economies (AEs). The subsequent decade saw central banks struggle to push inflation back to target before, like a bolt from the blue, the Covid-19 pandemic once again caused widespread financial system stress and plunged economies into a deep recession. The pandemic's aftermath, complicated by geopolitical events, saw the largest and most persistent inflationary outbreak in half a century, alongside bank strains on both sides of the Atlantic.
Central banks have risen to the challenge. Their forceful and repeated responses to financial stress stabilised the system and limited the damage to the economy. The shortfall of inflation from targets always remained contained. And following vigorous global tightening of the policy stance, inflation is now again returning to the price stability region while economic activity and labour markets have proved resilient (Chapter I).
These extraordinary events have left a deep imprint on the conduct of policy. Central bank responses have been unprecedented. Even before the pandemic, nominal policy rates had reached historical troughs, in some cases even hovering in negative territory. And central bank balance sheets have climbed to historical peaks, within ranges previously seen only during wars. Moreover, looking ahead, further challenges loom. Public debt is on a worrisome trajectory around the world and several structural forces, such as deglobalisation, ageing societies and the uncertainties of the green transition, could further complicate policy.
This chapter stands back and takes stock of this tumultuous historical phase. After summarising the key developments, it draws lessons from the conduct of monetary policy, fleshing out what has been learned about the effectiveness of strategies and tools. Based on these lessons, it then identifies a number of key considerations that could guide monetary policy in the years ahead and, where appropriate, help refine frameworks. These considerations stress the importance of robustness, realism in ambition, safety margins, nimbleness as well as the complementary role of other policies.
Monetary policy conduct in the 21st century: a brief review
The conduct of monetary policy in the 21st century can be broadly classified into two phases: (i) the GFC in AEs and its aftermath; and (ii) the global outbreak of the Covid-19 pandemic and its consequences. The two phases saw very different macroeconomic challenges, which deeply shaped the policy response (Graph 1).
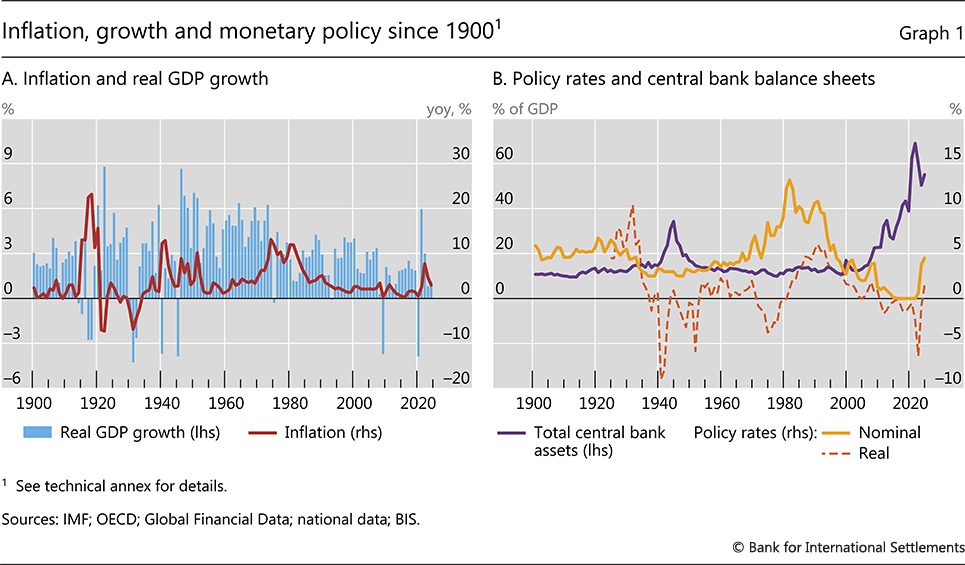
The GFC marked the end of the so-called Great Moderation – a period of remarkable macroeconomic stability, at least in advanced economies, that began in the mid-1980s. Under the surface of stable inflation and growth, however, financial vulnerabilities were building up, in particular in core AE housing and mortgage markets. Credit was surging, asset prices were booming, and balance sheets were becoming overstretched. The financial system looked deceptively strong, and its ever greater sophistication was mistaken for resilience. The build-up of vulnerabilities was reinforced by low nominal and real interest rates, as central banks eased policy in response to the fallout of the bursting of the dotcom bubble in 2001 and had little reason to raise them much subsequently given subdued inflation. In the background, prudential regulation and supervision had failed to keep up with developments.
The subsequent unwinding of financial imbalances ushered in the GFC and plunged many economies into the deepest recession since the Great Depression. Matters came to a head when the US investment bank Lehman Brothers filed for bankruptcy in September 2008. Many financial institutions teetered on the verge of insolvency, large segments of funding markets froze, and asset prices collapsed.
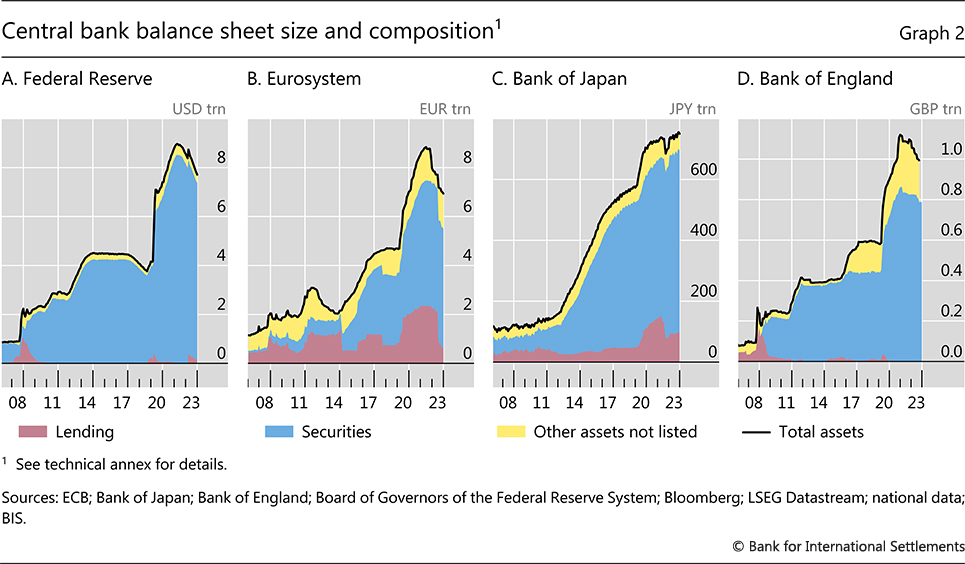
Central banks responded forcefully. They cut policy rates aggressively and activated their balance sheets to provide badly needed support (Graph 2). In the early phase of the crisis, they stepped in to provide liquidity to the financial sector, playing their role of lenders of last resort, often drawing on governments' solvency backing. Thus, the initial increase in major central banks' balance sheets largely took the form of lending to financial institutions. Subsequently, several central banks started large-scale asset purchases (LSAPs) to further ease financial conditions. As a result, their balance sheets expanded further, driven by large holdings of long-term bonds, notably government bonds, often financed by bank reserves ("quantitative easing" (QE)).
Once the post-GFC years saw a shallow economic recovery and persistent shortfalls of inflation from target, raising concerns about deflation, AE central banks engaged in an unprecedented forceful and prolonged monetary easing. In doing so, they naturally built on the same toolkit that they had deployed to contain the crisis and sought to influence financial conditions beyond the short-term interest rate more directly. They lowered policy rates to zero and sometimes even into negative territory; they resorted to forward guidance to signal their commitment to keep policy rates low for long; and they further expanded their LSAPs, sometimes including private sector assets such as corporate bonds or equity exchange-traded funds.
The Covid-19 pandemic abruptly ended an incipient monetary policy normalisation. As the global economy was put in hibernation to forestall a public health catastrophe, a deep economic contraction put the stability of the financial system at risk. Once again, central banks moved swiftly and forcefully to prevent financial collapse and restore confidence. They cut policy rates, where still possible, and launched new balance sheet measures, combining emergency or subsidised lending to banks with bond purchase programmes. In the wake of these measures, central bank balance sheets surged to new historical highs.
As the global economy rebounded from the pandemic, central banks faced an enemy they thought they had long defeated for good – a global outbreak of inflation, in many cases well into double digits. Supply had failed to respond elastically to the partly monetary and fiscal policy-induced recovery in demand and the major rotation of that demand from services to goods. The subsequent steep commodity price increases in the wake of the Russian invasion of Ukraine further fuelled the inflation surge.
Once it became clear that the inflation surge was not transitory and was raising the risk of a transition to a high-inflation regime, central banks responded forcefully. They embarked on the sharpest and globally most synchronised monetary tightening in a generation. They hiked policy rates strongly, at least in nominal terms, and began to shrink their balance sheets – so-called quantitative tightening.
This big picture summary of events since the beginning of the century hints at some significant differences between AEs and emerging market economies (EMEs). To be sure, just like AEs, EMEs battled the Covid-19 crisis and the subsequent inflation surge. But they were largely spared the travails of banking crises such as the GFC or sovereign crises such as the one in the euro area (Graph 3.A). Their enduring challenge was coping with swings in capital flows and exchange rates originating primarily from developments in AEs, not least due to the post-GFC extraordinary monetary easing in major AEs (Graph 3.B). These trends reversed sharply as the Federal Reserve took the first steps to normalise policy in 2013.
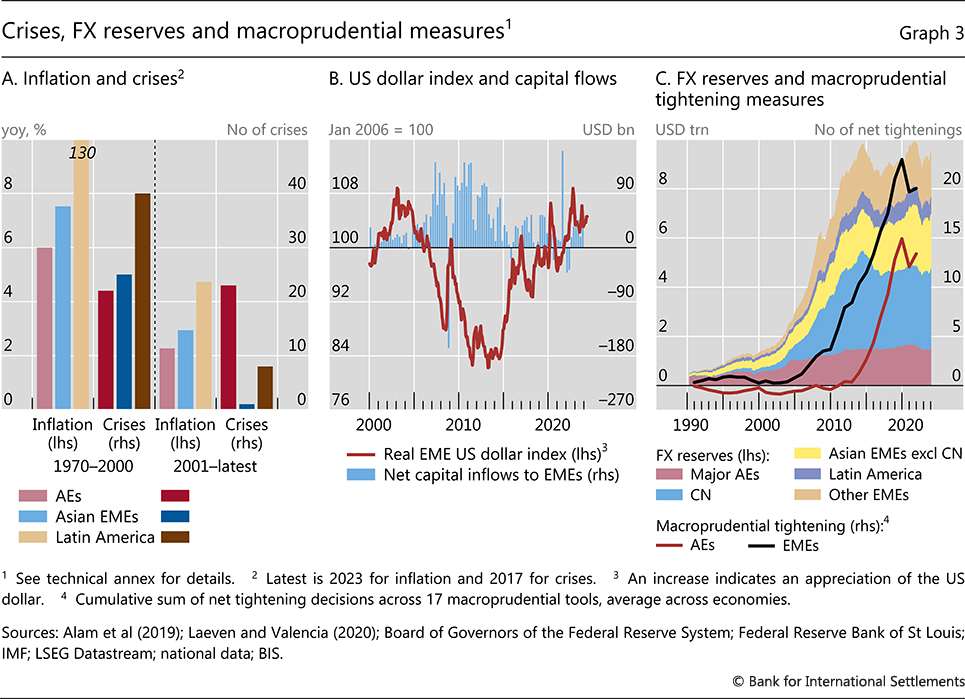
EME central banks weathered these challenges by relying on broad-based policy frameworks honed following their own crises in the early to mid-1990s. The frameworks often combined inflation targeting and greater exchange flexibility with varying degrees of FX intervention and active deployment of macroprudential tools (Graph 3.C).1 This represented a major welcome shift from previous frameworks that had helped generate the conditions of the EME crises pre-2000.
Lessons learned
Looking back at the experience since the GFC as well as the build-up to it, it is possible to draw lessons about the conduct of monetary policy and complementary tools under the central banks' influence. These lessons underscore the power of monetary policy but also shed light on its limitations, some of which were less appreciated during the period of the Great Moderation. The five lessons pertain, respectively, to central banks' ability to fight inflation; their ability to tackle financial system stress; the impact of prolonged easing; communication; and the deployment of tools such as FX intervention – part of the monetary policy toolkit – and macroprudential measures.
Central banks can forestall inflation de-anchoring
The post-pandemic experience with inflation has shown once again one of the major strengths of monetary policy. In particular, it has highlighted how forceful monetary tightening can prevent high inflation from becoming entrenched. It has also confirmed central banks' determination to avoid a repeat of the experience of the Great Inflation of the 1970s.
Admittedly, central banks, like most observers, were taken by surprise by the global inflation surge. The prevailing consensus was that the supply restrictions might raise prices, but that the post-pandemic environment would remain disinflationary: if anything, the pandemic-induced psychological and financial scars would depress demand and keep prices under pressure for years to come. There was initially also an underappreciation of the inflationary implications of the large demand stimulus from the monetary and fiscal policy response to the pandemic.2 This, in turn, reflected the difficulties in calibrating the response to those exceptional circumstances.
Moreover, it took some time for central banks to react. Initially, they judged the inflationary pressures to be temporary. In addition, the forward guidance they had provided to nurture the recovery may also have played a role, as may have the reviews of monetary policy frameworks that several major central banks completed at the time. They envisaged a world of persistent disinflationary pressures, in which the core problem would still be how to push inflation back to target and pre-empt a downward drift in inflation expectations. After such a long period of stubborn shortfalls from target, inflation overshoots could actually be helpful in that regard as long as they remained contained.
As soon as central banks realised that inflation threatened to become unmoored, they were quick to react and recover the ground lost. Hence the most intense and synchronised tightening in decades. In the end, the timing of this tightening did not prove crucial. True, countries that responded earlier gained precious room for policy manoeuvre, most notably those in Latin America with a longer inflation history. But, on balance, inflation outcomes did not vary systematically with the timing of the first hike. The global nature of the inflationary forces swamped the slight differences in timing.
The forceful response was justified by the nature of the inflation process. Evidence indicates that it is useful to think of inflation as evolving differently in a low- and a high-inflation regime, with transitions from low- to high-inflation regimes tending to be self-reinforcing.3
In a low-inflation regime, inflation has important self-stabilising properties. What is measured as inflation is, in fact, largely the result of idiosyncratic or sector-specific price changes that leave little imprint on the inflation rate itself. That is, the co-movement of prices, or the "common component" of price changes, is small. And wages and prices are only loosely linked.
By contrast, a high-inflation regime has no such self-stabilising properties. The common component of price changes is higher, and wages and prices are much more closely linked (Graph 4.A). As a result, inflation becomes more responsive to one-off inflationary shocks, such as increases in commodity prices or sharp depreciations of the exchange rate.
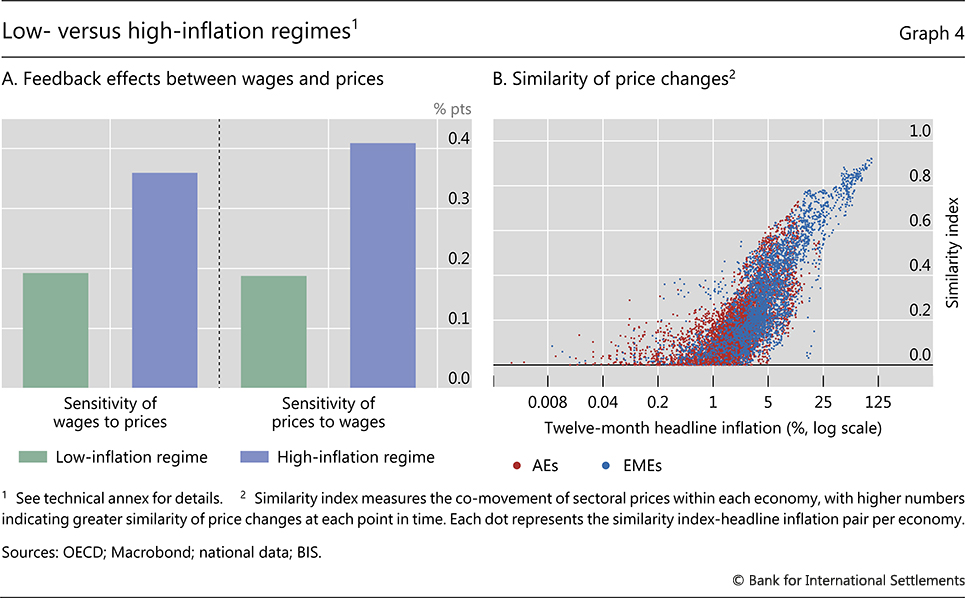
Transitions from low- to high-inflation regimes are self-reinforcing for several reasons. For one, inflation moves from the region of rational inattention, in which it is hardly noticed, into that of sharp focus. In addition, inflation becomes more representative: as the co-movement of prices increases (Graph 4.B), the inflation rates that different agents experience become more similar. Thus, inflation becomes a more relevant focal point and coordinating device for the decisions of economic agents. And the longer inflation remains high, the greater the risk that behaviour adjusts, entrenching an inflation psychology.
Monetary policy has contributed to bringing inflation under control in two ways (Chapter I). First, it has compressed aggregate demand relative to what it would otherwise have been. The resilience of economic activity and tightness of labour markets suggest that the compression of aggregate demand has also been supported by an increase in supply. Second, the commitment to bringing inflation under control provided a strong signal to markets, firms and workers that the central bank would do what it took to restore price stability. This helped prevent an inflation psychology from setting in, with behaviour adjusting to a high-inflation regime.
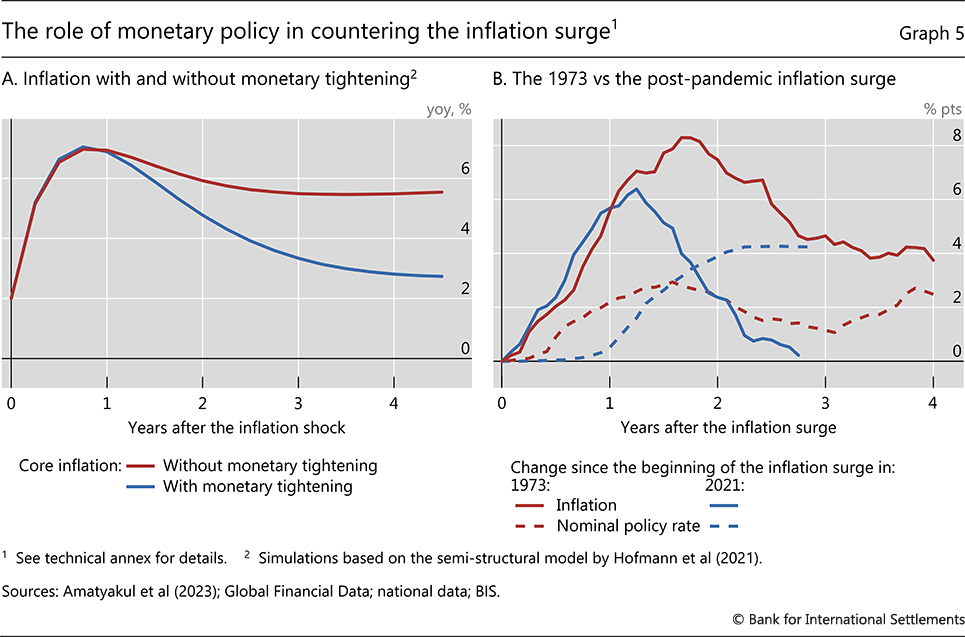
A look at simple models and at previous historical experience sheds light on the key role of policy.4 Graph 5.A illustrates simulations based on a model in which inflation expectations are influenced by inflation outcomes rather than being mechanically linked to the central bank's inflation target. Tightening monetary policy during an inflation surge is critical to prevent a de-anchoring of inflation expectations and avoid a transition to a high-inflation regime. This is broadly consistent with experience in the early 1970s, when a smaller and shorter-lived monetary policy response failed to prevent a shift to a high-inflation regime (Graph 5.B).
Central banks can stabilise the financial system in times of stress
The events of the past two decades have confirmed once again that central banks play a key role in the management of financial crises. During episodes of financial stress, stabilising the financial system is essential to prevent the economy from falling into a tailspin. As central banks are the ultimate source of liquidity, their actions are critical to boost confidence, tackle market dysfunction and support the flow of credit to firms and households. Thus, by deploying their firepower effectively, central banks can not only prevent inflation from becoming entrenched but also tackle a key source of deflationary pressures – major financial crises.
While at such times policy rates are typically cut, it is the forceful deployment of the balance sheet that does the heavy lifting. Following the GFC and the Covid-19 crisis, central banks deployed a whole range of tools.5 Reflecting the nature of the shock, the response to the Covid-19 crisis was even broader than that to the GFC and more heavily tilted towards markets.
Underlying the criticality of confidence, the evidence confirms that announcements play a key role in stabilising the system, well beyond the actual deployment of tools.6 A credible announcement signals the central bank's willingness to take the necessary actions to tackle dysfunctions. As an illustration, Graph 6.A documents the major impact of the announcement of LSAPs during the GFC, Mario Draghi's "whatever it takes" statement during the euro area sovereign debt crisis and the Federal Reserve's announcement of several measures during the Covid-19 crisis.
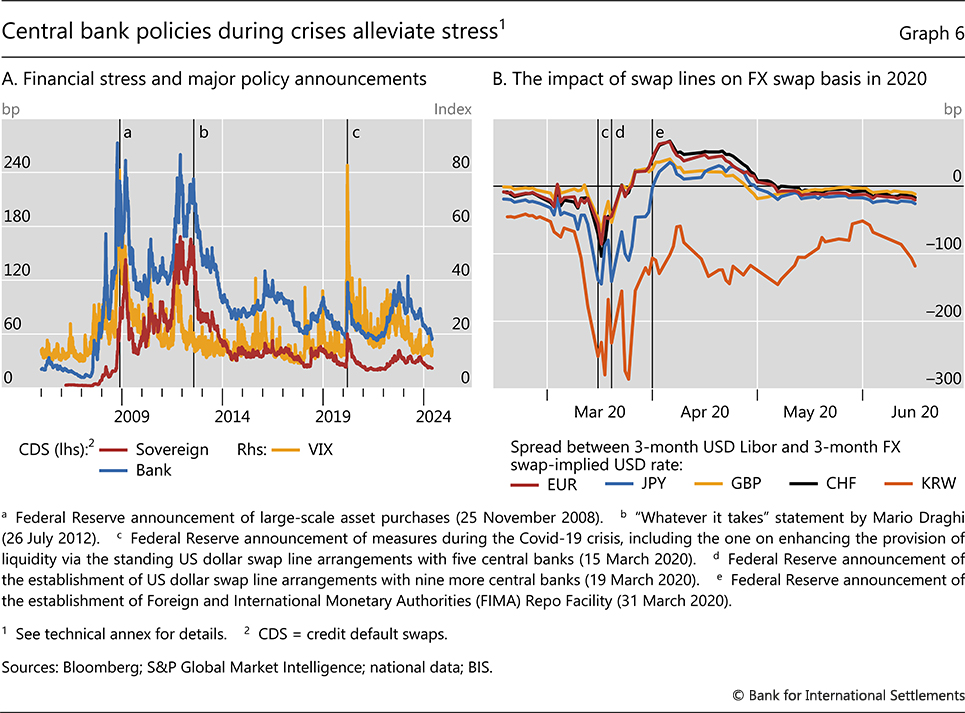
Episodes of financial stress also confirmed the importance of providing liquidity in foreign currency, highlighting the need for central bank cooperation. Here, international currencies are front and centre, especially the US dollar globally and the euro on a more regional scale.7 Self-insurance through the build-up of FX reserves helps but only up to a point (see section 5 below). Swap lines were repeatedly and effectively used to alleviate dollar funding shortages. During the GFC, the swap lines helped avoid the meltdown of the global financial system,8 and they again played a key role during the euro area sovereign debt crisis and the Covid-19 crisis. For example, during the Covid crisis, the announcement of better terms on the standing swap lines between five central banks and their reopening with nine others had an immediate impact on the US dollar FX swap basis – an indicator of global dollar funding conditions (Graph 6.B).9 The basis narrowed further as these swap lines were deployed. At the time, the Federal Reserve also complemented swap lines with a new repurchase agreement (repo) facility with much broader country access, allowing countries to deploy their FX reserves more easily while relieving selling pressure in the US Treasury market.
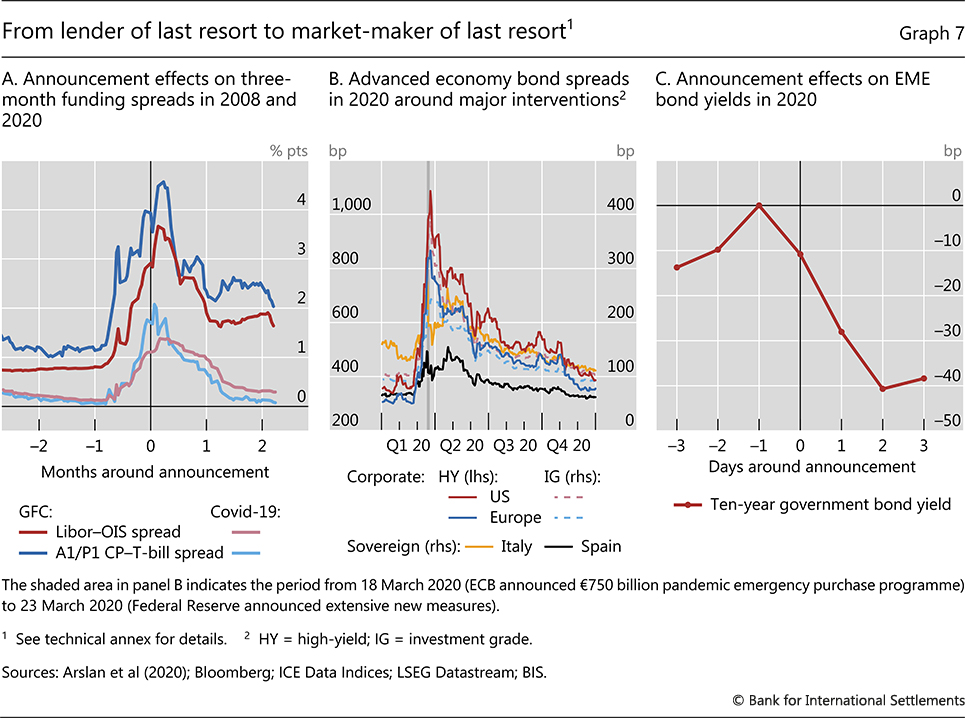
The financial crises also saw an important evolution in the role that central banks play in crisis management. Historically, central banks had focused on providing emergency funding to financial institutions, largely banks – the standard lender of last resort function. But that role could no longer suffice given the rapid growth of financial markets, of more complex financial instruments and of non-bank financial institutions (NBFIs).10 The setting up of asset purchase facilities also turned central banks into de facto market-makers or buyers of last resort and brought them into closer contact with non-banks, including investment vehicles.11 This allowed them to have a more direct impact on both funding spreads and secondary market spreads (Graphs 7.A and 7.B). In EMEs, this function was especially important during the pandemic, to alleviate market stress in domestic currency bond markets as foreign investors retreated (Graph 7.C).12
While successful, central bank interventions also pointed once again to certain limitations.
For one, liquidity provision alone is insufficient when broader solvency concerns are present. Hence the need to draw on government support, as the sovereign is the ultimate backstop of the financial system. For example, during both the GFC and Covid-19 crisis, government support through extensive guarantees and other measures was crucial to allow central banks to extend longer-term funding and assume credit risk.13 All this puts a premium on close cooperation. At the same time, it can raise delicate issues related to the relationship between the central bank and the government and their interlocking balance sheets. These issues can complicate the conduct of monetary policy in more normal times.14
In addition, and relatedly, interventions are not costless. Directly or indirectly, the central bank typically puts its balance sheet at risk, absorbing risks that the private sector is unable or unwilling to take on. Moreover, the calibration of the support is difficult, and there is a natural tendency to err on the side of doing too much rather than too little. In turn, the expectation of such interventions in the future can temper market discipline and fuel risk-taking – moral hazard.15 The issue is especially relevant when central banks purchase assets outright, absorbing risk more directly. The standard way to limit moral hazard is by ensuring that risks are adequately priced and borne by market participants, especially through regulation, but this has proved especially hard in the NBFI sector (Chapter I).
Prolonged monetary easing runs into limits
If the post-pandemic fight against inflation and the management of two major episodes of stress highlighted the strengths of monetary policy, the post-GFC years also brought to light some of its limitations. To be sure, the post-GFC unprecedented phase of monetary easing through a wide range of new tools was instrumental in promoting economic recovery and maintaining price stability. That said, as time wore on, some limitations that had tended to be underplayed at the outset became more evident.16 These include, in particular, signs of reduced traction as well as longer-term side effects on the financial system and the economy.
Limited traction
The empirical evidence clearly indicates that unconventional policy measures allowed central banks to ease financial conditions much further.17 Large-scale asset purchases helped compress risk (term and credit) premia and, by underlining central banks' willingness to keep interest rates low, influenced expectations of policy rates further out in the future – the signalling channel.18 Forward guidance helped shape those expectations more directly and, by reducing uncertainty about the policy rate path, compressed risk premia too. Negative interest rates were transmitted to money market and capital market rates very much like other policy rate cuts, thereby also having a similar impact on the exchange rate. And special lending programmes supported banks' profitability and encouraged lending.
At the same time, the evidence also points to some limitations.19 They concern the impact on financial conditions and that of financial conditions on economic activity and inflation.
Some of the limitations regarding the influence on financial conditions are instrument-specific. The power of LSAPs is weaker when markets are not under stress, as the emergency support role of the central bank is not at work.20 That power also appears to wane at the margin as purchases grow, although the evidence here may also reflect difficulties in identifying the "surprise" element if the central bank becomes more predictable (Box A).21 The pass-through of negative interest rates to the rates charged by intermediaries has proven to be somewhat weaker than that to money and capital market rates. This has particularly been the case for deposit rates, given banks' reluctance to cut them below zero, especially for retail depositors. And special lending schemes may not always have encouraged the targeted lending.22
Other limitations regarding the influence on financial conditions are of a more general nature. There are limits to how far risk premia can be compressed, to how far central banks can commit to keeping interest rates low in future and to how far they can push rates into negative territory – and do so without unnerving private market participants, potentially signalling dire conditions or weakening intermediation. For instance, this may be a reason why the impact of monetary easing on bank lending appears to diminish when interest rates are very low for long periods.23
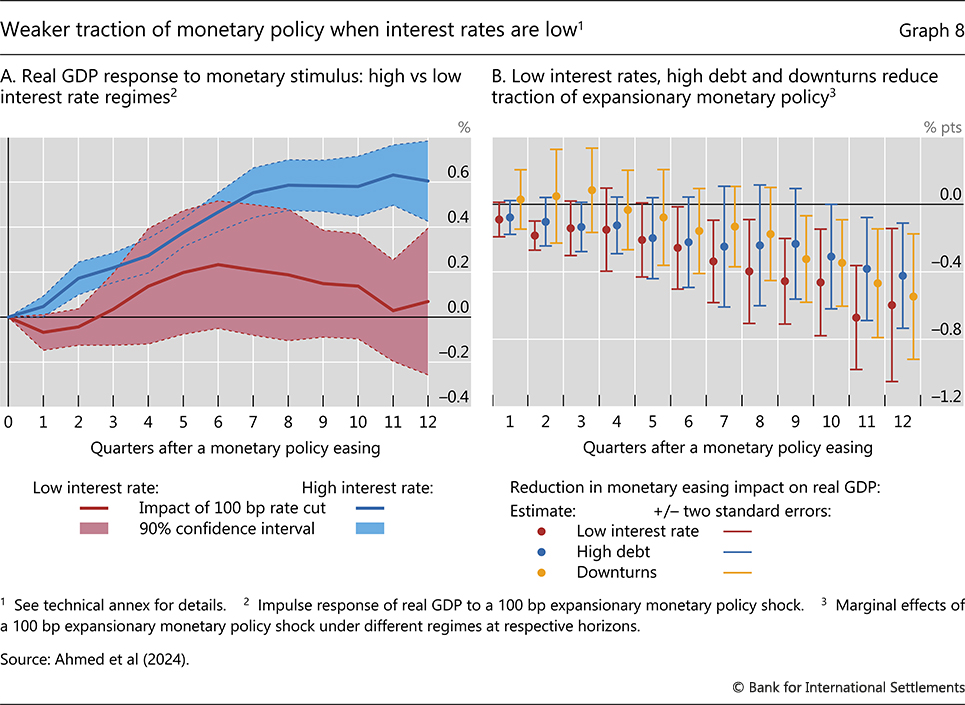
A sense of diminishing returns to strong and prolonged easing also comes from the behaviour of the economy and inflation. There is evidence that easing had a lesser impact on real activity after the GFC compared with the preceding decades (Graph 8.A).24 One important reason is that financial recessions blow powerful headwinds. Agents give priority to repairing balance sheets and it takes time for resources to be reallocated and for the capital overhang to be reabsorbed.25 In addition, broader factors appear to have been at work.
One factor is that low interest rates may lose traction on economic activity as they reach low levels and stay there. There may be several reasons for this. Not least, there are limits to the extent to which expenditure may be brought forward from the future. Moreover, a few basis points may hardly be noticed once borrowing costs are already very low; sticky hurdle rates for investment are a case in point. Empirical evidence is consistent with this loss of traction.26 It shows a weaker impact at the margin in a very low interest rate environment even when controlling for phases of economic recession and high debt (Graph 8.B).
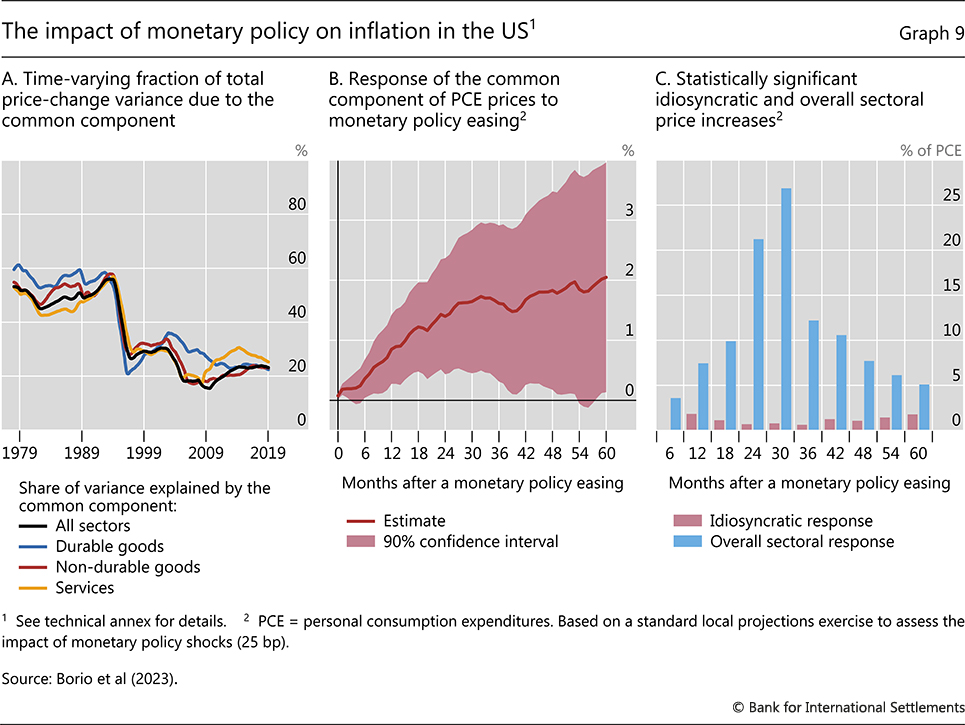
Similarly, there is evidence that in a low-inflation regime, inflation becomes less sensitive to monetary policy easing.27 One possible reason is that, as low inflation becomes entrenched, the common component of price changes drops substantially (Graph 9.A), and this is the component on which changes in the monetary policy stance mainly operate. It is the one closely linked to economy-wide forces such as aggregate demand or the exchange rate. Indeed, monetary policy surprises appear to have a persistent impact on the common component of price changes (Graph 9.B) but a much more limited one on the idiosyncratic elements (Graph 9.C). Consistent with this finding, in a low-inflation regime, monetary policy appears to operate through a remarkably narrow set of prices, with a statistically significant impact for only about a quarter of the sectors, even after 36 months (Graph 9.C).
Side effects and costs
A more limited traction worsens the trade-off between the benefits and costs of prolonged and aggressive monetary easing. Some of the costs become apparent only when interest rates remain exceptionally low for very long. These include the build-up of debt, capital misallocation, the declining profitability of financial intermediaries and impaired market functioning. In addition, such policies can have undesirable consequences for central banks themselves to the extent that they narrow the room for policy manoeuvre, reflecting difficulties in devising exit strategies and tighter interlinkages with the government.
Prolonged periods of very low interest rates can weaken the profitability of financial intermediaries and erode their resilience.28 Banks are a case in point. To be sure, an easy stance lifts profits by boosting asset values and spurring economic activity. But in the longer run these effects tend to wane or even reverse, and the more lasting impact operates through compressed net interest margins, as deposit rates are sticky, and through lower returns to maturity transformation, particularly if LSAPs depress the term premium (Graph 10.A). Central banks have actively sought to limit such side effects by providing relief through interest offered on intra-marginal reserve holdings. Insurance companies and pension funds also suffer (Graph 10.B). This is mainly because the maturity of their liabilities exceeds that of their assets, so that their value increases by more as interest rates decline.
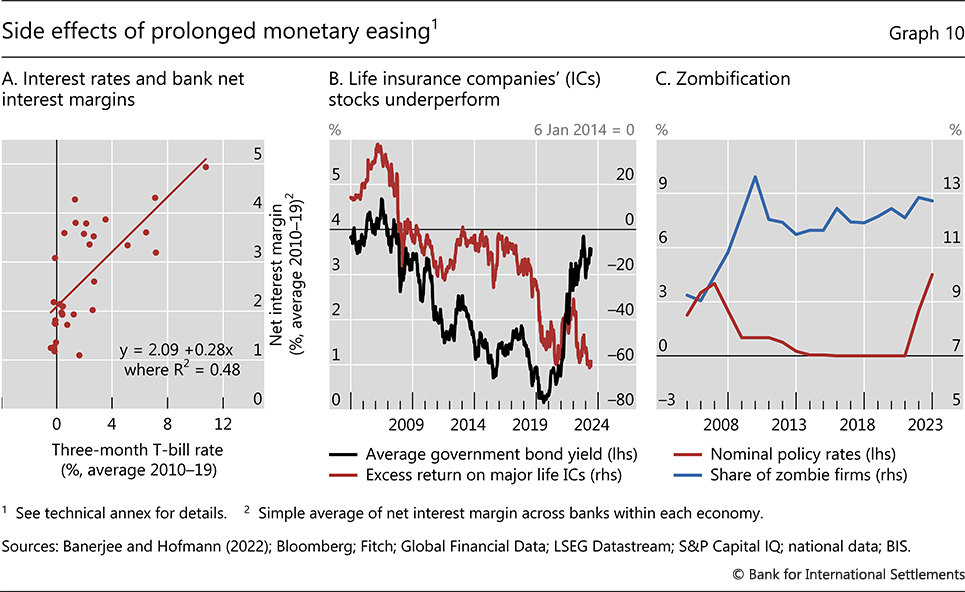
Prolonged periods of low interest rates can also weaken non-financial firms. It is easier for unprofitable enterprises to remain in business when borrowing costs are very low and lenders have a greater incentive to "extend and pretend", given the lower opportunity cost of forbearance. Eventually, some firms might even borrow primarily to service existing debt and avoid exiting or restructuring – so-called zombies (Graph 10.C). This contributes to the misallocation of labour and capital by crowding out more productive businesses. Empirical evidence tends to confirm this observation.29 It finds a ratcheting up in the prevalence of zombies since the late 1980s linked to reduced financial pressure and hence lower interest rates even after accounting for other factors. The evidence also points to crowding out effects.
More generally, prolonged monetary easing can inadvertently contribute to the build-up of financial vulnerabilities. This is in part inherent to the transmission mechanism. Monetary policy works to an important extent by boosting credit and asset prices, including by compressing risk premia and encouraging risk-taking. These effects remain contained during normal business fluctuations but can generate vulnerabilities if the easing is prolonged. Indeed, growing empirical evidence indicates that such easing can, over time, increase the probability of financial stress.30 For example, the sharp increase in interest rates to fight the recent inflation flare-up tested the business and trading strategies put in place during the low-for-long period and was at the root of valuation losses on government and mortgage bonds that caused banking strains in March 2023. Likewise, the GFC itself was arguably in part the result of the period of low rates that preceded it.
This raises the risk that, over time and successive cycles, monetary policy may lose room for manoeuvre. As the post-GFC experience has highlighted, financial recessions are especially deep and call for strong and prolonged easing. And inflation can be less responsive to such easing in a low-inflation regime (see above).
The risk of loss of room for manoeuvre in part also reflects "exit" difficulties. There are inherent asymmetries in the conduct of policy. When central banks seek to stabilise the system, they naturally act forcefully. And the effectiveness of their actions partly hinges on the ability to surprise markets, thereby maximising the impact. By contrast, when exiting, they naturally seek to limit that impact, in part to simplify communication about the policy stance (see below). This counsels gradualism. And this gradualism is reinforced by concerns about untoward market reactions, not least those stemming from the vulnerabilities that may have built up over time. Examples abound, ranging from the taper tantrum in May 2013 (see below) to the US money market ructions in September 2019 or the tremors in the UK bond market in September 2022.
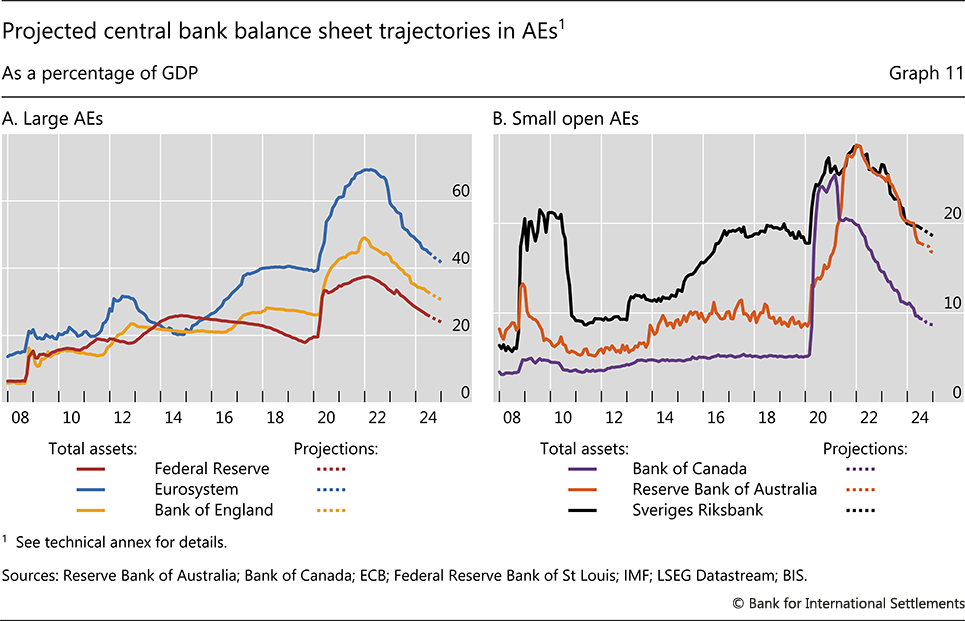
This explains why the speed in the contraction of central bank balance sheets has been so gradual and is projected to remain so (Graph 11). Many central banks opted for a measured approach, employing strategies like letting bonds mature; only a few resorted to outright sales. Apart from a few incidents, the experience so far suggests that the impact of the balance sheet unwinding on financial markets has been benign.31
Large and risky balance sheets, in turn, may constrain the central banks' room for policy manoeuvre. In part, this stems from the political economy of central bank financial results, especially losses (Box B). Central banks can operate even with negative equity, as many have. Moreover, their performance should not be judged on financial results but on how well they fulfil the assigned mandate. Even so, largely because of the impact on the government's fiscal position and the central bank's credibility, losses can raise political economy challenges that, unless properly addressed, could unduly constrain policy. More generally, the constraints simply reflect the costs that larger balance sheets can have on the financial system and economy through the channels discussed in this section.
Communication has become more complicated
Communication has always been integral to monetary policy. Moreover, its role has grown over decades, as central banks have become more transparent due to changes in intellectual paradigms, in the heft of markets and in institutional set-ups. Greater transparency has been seen as essential to strengthen effectiveness and accountability.
At the same time, since the GFC communication has become more complicated. Three factors have been responsible: the willingness to influence financial conditions beyond changes in policy rates, the multiplicity of tools used to set the stance, and surprising changes in macroeconomic conditions.
Financial conditions depend not only on what monetary policy does today but also on what it is expected to do in the future. This influences interest rates at longer maturities and the whole array of financial conditions. Therefore, even when policy was limited to adjustments in the (short-term) policy rate prior to the GFC, central banks provided information about how they thought policy would evolve. That said, at the time communication was largely designed to provide guidance about the central bank reaction function. This was so even when central banks published the likely path of policy rates, as a handful did.
The nature of forward guidance changed once policy rates hit the perceived effective lower bound. At that point, forward guidance was explicitly employed to ease the monetary policy stance further. This meant providing some form of assurance that interest rates would remain lower for longer. In turn, this involved an element of commitment. Commitment, by its very nature, reduces flexibility to respond to unexpected events. Central banks addressed this trade-off in various ways, by emphasising to different degrees the conditionality of the guidance.32 But given the underlying intention, even when conditionality was emphasised, it was often discounted by markets and the public at large. In some cases, this ended up either constraining the flexibility to adjust to rapidly changing conditions or undermining the credibility of the institution when it did change course.
The sheer multiplicity of tools has complicated communication by making it harder to understand the policy stance. First, the stance could no longer be identified with the behaviour of a single variable, and aggregating the impact of different tools proved exceedingly hard. Second, the very impact of the tools in some cases was difficult to disentangle. An obvious example is the information that LSAPs could convey about future policy interest rates, underpinning forward guidance. Third, the fact that the same tool can be used for quite different purposes – setting the stance and managing market stress – made it hard to distinguish the two objectives.
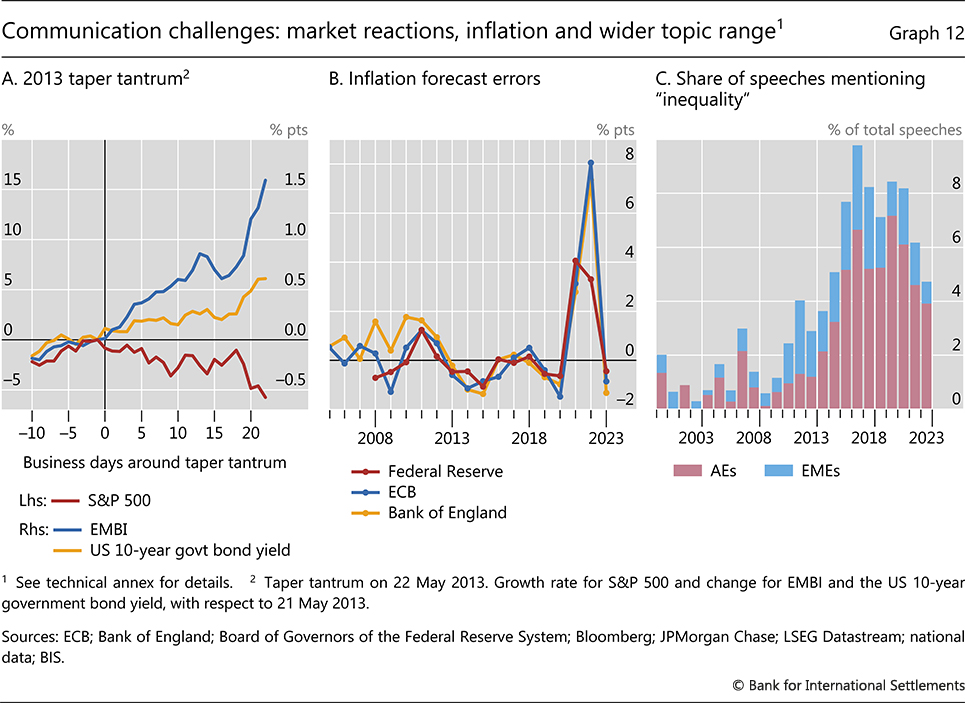
At times, these complications caused unwelcome market reactions. The taper tantrum is probably the most salient example. The mere announcement of a slowdown in the pace of asset purchases by the Federal Reserve triggered turmoil in US financial markets, with major global reverberations, in particular for EMEs (Graph 12.A).
Central banks have taken steps to manage this complexity. On the one hand, they have de-emphasised the role of asset purchases as an element of the monetary policy stance. As central bank balance sheets have started contracting, the pace of reduction has either been put on autopilot or portrayed as reflecting objectives other than managing the economy and inflation. On the other hand, they have sought to distinguish balance sheet operations designed to manage financial stress from those designed to alter financial conditions in the light of macroeconomic developments. For instance, during the government bond market turmoil in September 2022, the Bank of England explicitly clarified that the asset purchases should in no way be interpreted as slowing down the tightening of policy.
The main macroeconomic development complicating communication has been the surprising behaviour of inflation. In the aftermath of the GFC, when inflation remained stubbornly below target, a common challenge was to justify unprecedented policy settings designed to push it back up despite concerns about its perceived adverse effects, not least on inequality.33 The possible impact of exceptionally low rates on income and wealth distribution was more easily understandable than the costs of low inflation. When inflation subsequently surged, the challenge was to explain the reasons for the failure to anticipate it, as reflected in large forecast errors across central banks (Graph 12.B), to convey the exceptional uncertainty surrounding the outlook without sapping confidence and to underline the unwavering commitment to restoring price stability.34 Both situations risked undermining the central bank's reputation and credibility.
Meeting these challenges required central banks to go out of their comfort zone. They had to address topics that would normally be the preserve of other authorities, such as inequality (Graph 12.C). And they had to address the public more directly, adjusting their language and communication style to the targeted audience.35 Tackling these challenges did not prove easy. Central banks had to address a dangerous expectations gap between what they can deliver and what they are expected to deliver. This challenge will also be a defining one in the years ahead.
FX intervention and macroprudential policies can enhance stability
While the GFC appeared as an isolated meteor strike, it had in fact followed a growing number of banking and financial crises in both AEs and EMEs. These events have underlined the near-term trade-offs between price and financial stability and hence the need for instruments that could complement interest rate policy to manage them.
In that context, FX intervention and macroprudential policies can play an important role. They can help tackle the challenges arising from swings in global financial conditions and from the build-up and unwinding of domestic financial imbalances.36 This is the lesson in particular from EMEs, which have experienced much greater financial and external stability than in preceding decades. Of course, over the past decades, by far the most fundamental shift in EME monetary policy frameworks has been the adoption of variants of inflation targeting regimes together with the pursuit of a more coherent macroeconomic policy stance, including a greater degree of exchange rate flexibility. At the same time, FX intervention has remained a common complementary tool, and macroprudential measures have further enriched the toolkit.37
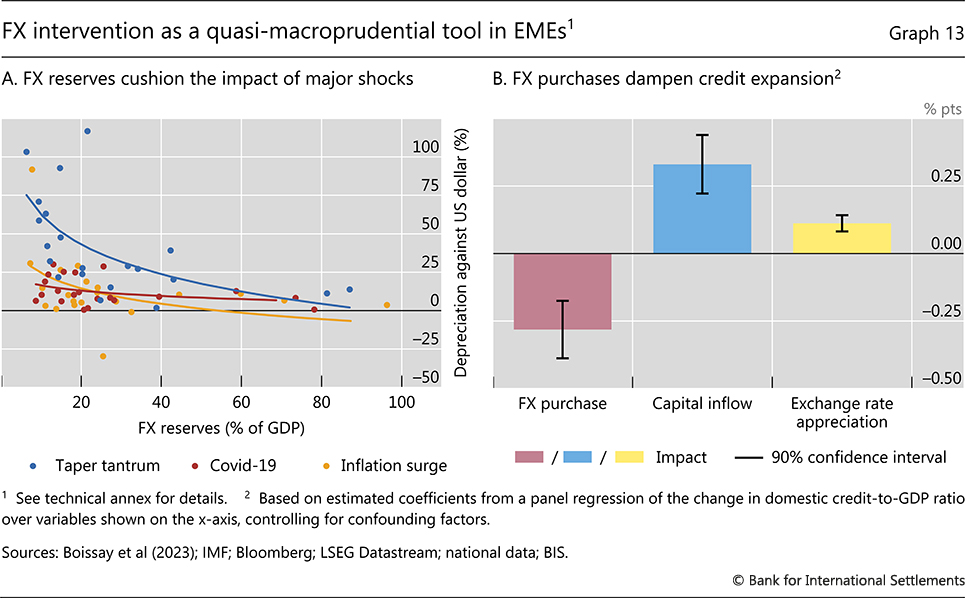
Used wisely and prudently, FX intervention can help improve the trade-off between price and financial stability in two ways.38 First, it can build FX buffers against future sudden outflows and depreciations.39 For this, it does not even need to influence the exchange rate. Second, it can help lean against the unwelcome domestic consequences of capital flow and exchange rate fluctuations. Specifically, during a phase of strong capital inflows that put upward pressure on the currency, FX purchases can dampen the build-up of financial imbalances through the financial channel of the exchange rate and, possibly, by "crowding out" lending through the sale of sterilisation instruments.40 Moreover, it allows interest rates to be kept somewhat higher than would otherwise be the case, limiting at least for some time the build-up of domestic financial imbalances. These two functions of FX intervention apply regardless of specific intervention strategies, tactics and instruments, which have varied considerably over time and across countries.41
There is empirical evidence supporting both functions. For instance, during several episodes of financial stress, including the GFC, the taper tantrum and the Covid-19 pandemic, EMEs with larger reserve buffers experienced smaller currency depreciations (Graph 13.A).42 Similarly, FX intervention can restrain the impact of capital flows and exchange rate appreciation on domestic credit expansion. As an illustration, Graph 13.B shows that FX purchases dampen domestic credit growth in a way that is quantitatively similar to the expansionary effects of capital inflows and exchange rate appreciation.
At the same time, central banks also face difficult trade-offs in the use of FX intervention. The fiscal cost of carrying reserves can be considerable. This is especially true when interest rates are very low in reserve currencies, and for countries with high domestic interest rates. Moreover, to the extent that FX intervention reduces exchange rate volatility and possibly even the sense of two-way risk, it may induce further pressure on the exchange rate. And in the longer run, it may encourage currency mismatches, making economies more vulnerable to global financial conditions. How far precautionary reserves are accumulated and intervention is used as a stabilisation tool will depend on a cost-benefit analysis, which will vary across countries and over time. Restraint is of the essence, especially to ensure that it is not perceived as a substitute for necessary monetary and fiscal adjustments.
In contrast to FX intervention, macroprudential measures are one step removed from monetary policy and are of more recent vintage. The measures are designed to complement microprudential regulation and supervision in strengthening the resilience of the financial system. Unlike their microprudential counterparts, macroprudential tools are explicitly calibrated with respect to system-wide variables, such as credit expansion (eg the countercyclical capital buffer) or the state of borrowers' balance sheets (eg maximum debt-to-income or loan-to-value ratios).
Much like FX reserves, macroprudential measures perform a dual function. They build up resilience in case stress emerges; and they can lean against the build-up of financial imbalances. As such, they can also enhance the monetary policy room for manoeuvre.
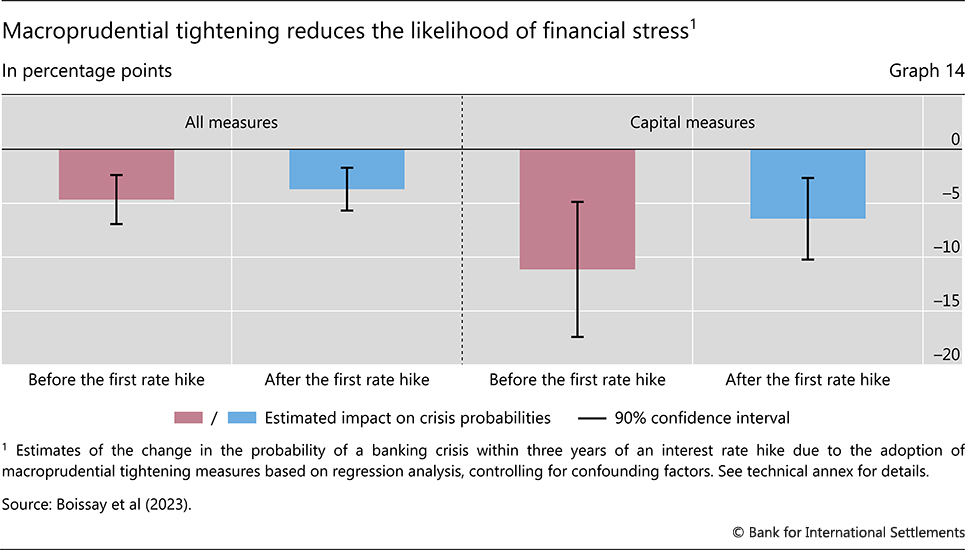
There is increasing evidence that macroprudential tools can play a key role in this context. The evidence indicates that the active use of macroprudential measures reduces the likelihood of crises. And it also indicates that, to varying degrees, such measures help reduce credit expansion and asset price increases, thereby dampening the amplitude of financial cycles. As an illustration, Graph 14 shows that the tightening of macroprudential policies reduces the likelihood of a crisis, regardless of whether it precedes or follows an interest rate hike. The impact of macroprudential tightening through instruments related to bank capital in reducing distress is stronger, especially when they are tightened prior to the tightening of monetary policy.
That said, as is the case with FX interventions, macroprudential measures are no panacea. Macroprudential tools are largely bank-based – a drawback that has become more relevant given the rapid growth of the NBFI sector. Like any form of regulation, they are prone to circumvention, ie they "leak". And their activation is subject to an "inaction bias", since the benefits are much more distant and less visible than the costs, including those of a political economy nature. Not surprisingly, the evidence suggests that macroprudential measures alone cannot always sufficiently contain the build-up of financial imbalances. They are best regarded as complements rather than substitutes for monetary and fiscal policy in the pursuit of macro-financial stability.
Challenges ahead
Going forward, monetary policy may well face an environment no less challenging than the one that has prevailed in the past decades. Two related factors are especially worrisome: fiscal trajectories and deep-seated adverse supply-side forces.
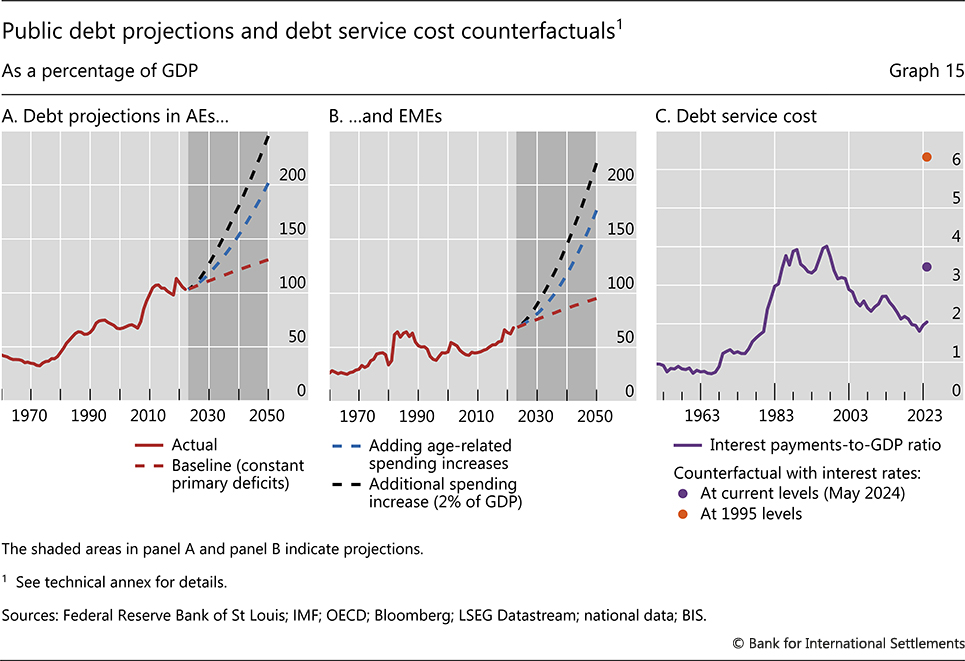
As argued in detail in last year's Annual Economic Report (AER), longer-term government debt trajectories pose the biggest threat to macroeconomic and financial stability.43 Stylised projections underline this point. Even if interest rates return to levels below growth rates, absent consolidation, ratios of debt to gross domestic product (GDP) will continue to climb in the long term from their current historical peaks (Graph 15.A and 15.B). The increase would be substantially larger if one factored in the spending pressures arising from population ageing, the green transition and higher defence spending linked to possible geopolitical tensions. The picture would be bleaker should interest rates settle above growth rates – something that has happened quite often in the past and would be more likely should the sovereign's creditworthiness come into doubt at some point. The trend decline in credit ratings in AEs and EMEs highlights this risk.
To fix ideas, consider some sensitivity analysis regarding the debt service. If interest rates remain at current levels, as governments refinance maturing bonds, the debt service burden will rise close to the record levels of the 1980s and 1990s. Should rates climb further, say, reaching the levels prevailing in the mid-1990s, debt service burdens would soar to new historical peaks, above 6% of GDP (Graph 15.C).
Higher public sector debt can constrain the room for monetary policy manoeuvre by worsening trade-offs. It can make it harder to achieve price stability. Higher debt raises the sensitivity of fiscal positions to policy rates. This increases the costs of a tightening and partly offsets its effects by boosting the interest income of the private sector. In the extreme, if high debt cripples the credibility of fiscal policy or the creditworthiness of the sovereign, it can hamstring monetary policy: a tightening would simply heighten those concerns and fuel inflation, typically through an uncontrolled exchange rate depreciation.44 High debt can also threaten financial stability. Losses on public sector debt, whether caused by credit or interest rate risk, can generate financial stress; in turn, a weak sovereign cannot provide adequate backing for the financial system, regardless of the origin of the stress.
The historical record has driven this message home repeatedly. Quite apart from inflationary pressures induced by expansionary fiscal policy, in evidence post-pandemic, there are many instances in which unsustainable fiscal policies have derailed inflation, especially in EMEs. Similarly, the past decade has shown the potential for the sovereign sector to cause financial instability, first as a result of credit risk (the euro area sovereign crisis) and more recently because of interest rate risk (eg the strains in the US banking sector in March 2023 or those in the UK NBFI sector in September 2022).
In addition, the evolution of deep-seated structural forces could sap the growth potential of the global economy and make supply less "elastic", ie less responsive to shifts in demand. In some cases, this would be a reversal of previous trends. The globalisation of the real side of the economy has been a major factor making supply more resilient, through trade integration and migration flows. Now, there are signs that it may be in retreat, largely driven by geopolitical forces and domestic politics. And the demographic dividend is set to vanish: populations are ageing and population growth is declining. In other cases, previous trends would continue, if not accelerate, but they would interact with new policy responses. This is the case of climate change. If left unchecked, physical events would cause growing damage to the world's productive capacity. But the transition towards a greener economy also calls for a major reallocation of resources that can be painful, especially if disorderly.
A slower-growing and less elastic supply could make the world more inflation- prone. Globalisation has been a major disinflationary force. It has greatly increased the size and reduced the cost of the effective global labour force; it has sapped the pricing power of labour and firms; and it has made inflation less responsive to country-specific excess demand. Demographics may also have played a role in keeping inflation low, not least by reducing wage pressures. And the green transition could lead to major commodity price increases if excess demand for the needed new minerals coexists with underinvestment in fossil fuels. Moreover, these same forces could also raise inflationary pressures indirectly by weakening fiscal positions.
At the same time, a return to the pre-pandemic less-inflationary world cannot be ruled out. Deglobalisation is not a given. Demographic forces may turn out to exert less pressure on inflation than anticipated. The green transition could be smoother than expected, especially if technological breakthroughs occur. And, more generally, technological change could accelerate, as suggested by the artificial intelligence revolution (Chapter III). In such a world, central banks would likely face similar challenges to those they tackled pre-pandemic, with persistent inflation shortfalls from target. If the events of the 21st century have highlighted one thing, it is the genuine uncertainty and unpredictability of the challenges central banks face.
Implications for monetary policy
Central banks need to continuously evaluate the effectiveness and credibility of their frameworks to bolster trust in monetary policy. The lessons learned so far in the 21st century and the challenges ahead can be helpful in informing that exercise. They suggest that it would be desirable for monetary policy frameworks to pay particular attention to four aspects: robustness, realism in ambition, safety margins and nimbleness. They also point to the importance of complementary policies.
Robustness
Monetary policy frameworks need to be robust to radically different scenarios. The global economic environment is constantly changing and producing challenges from unexpected quarters. Sometimes those challenges result from a complex interaction between structural forces and the policy regimes themselves. For example, as argued in detail in last year's AER, the combination of financial liberalisation, the globalisation of the real economy and monetary policy regimes focused on near-term inflation control shaped the nature of pre-pandemic business fluctuations. It was not so much rising inflation but the build-up of financial imbalances that signalled unsustainable economic expansions. Sometimes those challenges result from forces that have no economic origin or are more loosely related to economic factors. Examples include the Covid-19 crisis and the geopolitical and political tectonic shifts under way.
Looking ahead, this means two things. Frameworks should be fit for purpose regardless of whether inflationary or disinflationary pressures will prevail. And they should not be overly reliant on concepts that are very hard to measure.
Monetary policy strategy reviews conducted in the early 2020s were largely based on the premise that stubbornly low inflation would continue to prevail. In such a world, a key consideration was how to regain precious room for manoeuvre to fight downturns and prevent price declines from becoming unmoored, not least by anchoring inflation expectations. This also meant greater tolerance for target overshoots. The unexpected and prolonged post-pandemic inflation surge demonstrated that the challenges were in fact much more symmetric.
A notion motivating the reviews was that the equilibrium real interest rate – in jargon, the natural rate of interest, or r-star – was structurally very low by historical standards and independent of monetary policy even over long horizons. Given that premise, regaining room for policy manoeuvre on a sustainable basis necessarily meant trying to push inflation up even when it was not that far away from target. That is, it called for losing room for manoeuvre today in the expectation of regaining it tomorrow. As it turned out, this proved a risky strategy given the limited responsiveness of inflation to changes in the policy stance in the low-inflation regime. Analytically, r-star is a compelling concept. But its measurement is fraught with difficulties, and our understanding of its drivers is quite limited (Box C). Ideally, frameworks as well as policy calibration should limit as far as possible dependence on notions such as r-star, which are so hard to pin down.
Realism in ambition
An overarching consideration in the design of the conduct of monetary policy is realism in the degree of ambition, ie a realistic view of what monetary policy can and cannot deliver. This also shapes the institutional arrangements and communication strategies that support the execution of policy.
The experience of recent decades confirms what the broader history of central banking had indicated all along: an appropriate objective for monetary policy is to keep inflation within the region of price stability while helping to safeguard financial stability. In other words, the objective is simply to try to keep the economy roughly on an even keel, so that monetary and financial forces do not derail it. This is the best way to promote an environment conducive to sustainable growth, in which supply forces are fully allowed to play their role. To be sure, this is not something monetary policy can do on its own: it requires coherence across policy domains (see below). But the objective does provide guidance about the conduct of policy.
Realism in ambition in the context of the price stability objective means two things. First, it means not seeking to fine-tune inflation when it is already evolving within a low-inflation regime. The post-GFC experience underscored how difficult this is to do. A more realistic objective is to seek to keep inflation broadly within that regime, in which its impact on behaviour is not material and self-stabilising properties rule. This, in turn, would not be consistent with adjusting current inflation targets upwards. Second, it means reacting strongly when inflation moves sharply above the region and threatens to become entrenched, especially given the self-reinforcing nature of transitions from low- to high-inflation regimes. It is one thing to avoid fine-tuning, leveraging the self-stabilising properties of the low-inflation regime; it is quite another to put the system's self-equilibrating properties to the test.
Realism in ambition also means avoiding testing the limits of sustainable economic expansions. This is true regardless of whether those limits are signalled by higher inflation, as in the 1970s and more recently, or by the build-up of financial imbalances, as during much of the pre-pandemic era. In both cases, this requires tackling head on the serious intertemporal trade-offs involved. In the case of inflation, the temptation to boost economic activity in the short term can call for a larger contraction down the road, as monetary policy needs to squeeze inflation out of the system. In the case of financial imbalances, their spontaneous unwinding would itself cause a costly recession and possibly financial crises. The differences between the two cases relate to the time frame – financial imbalances normally take considerably longer to build up and unwind than excess demand-induced inflation – and the room for policy manoeuvre – interest rates rise to tame inflation but drop substantially to fight a financial recession.
Managing these intertemporal trade-offs calls for supporting institutional arrangements. This is because it requires taking unpalatable and politically unpopular decisions, which imply incurring short-term costs to reap larger longer-term, but less visible, benefits. Central bank independence that is broadly supported by society provides a precious degree of insulation.
Communication has an important role to play too. The challenge is to narrow the perceptions gap between what central banks can deliver and what they are expected to deliver. This gap can increase the general pressure on the central bank to abandon the appropriate degree of realism in ambition. Narrowing the gap calls for a continuous education effort.
Finally, realism in ambition also means focusing on the pursuit of objectives for which monetary policy is well equipped. Monetary policy has appropriate tools to pursue price and financial stability, by helping to keep the economy on an even keel over the medium term. But it can easily become overburdened when required to trade off these objectives against others, such as inequality or overly ambitious climate change agendas.45 Having many objectives without adequate tools to pursue them raises potentially serious reputational risks, which may only become apparent over time.
Safety margins
The post-GFC period highlights that there is a premium on retaining safety margins, ie room for policy manoeuvre. In general, an economy operating without safety margins is vulnerable to the inevitable slowdown and to unexpected costly developments. Safety margins, or buffers, are essential for resilience.
Retaining safety margins has proved very hard for monetary policy – just as it has for fiscal policy. As policy rates trended down and central bank balance sheets soared, the monetary policy room for manoeuvre progressively narrowed. This posed a major challenge when the pandemic hit and central banks had to provide support. Central banks did rise to the challenge, but at the inevitable cost of narrowing safety margins further.
Retaining safety margins requires integrating this consideration explicitly in the conduct of policy. One option would be greater tolerance for moderate, even if persistent, shortfalls of inflation from narrowly defined targets. This would leverage the self-stabilising properties of inflation in low-inflation regimes. It would recognise the more limited traction of changes in the policy stance in those circumstances. And it would allow monetary policy to more systematically incorporate longer-run considerations associated with the slow-moving but disruptive evolution of financial imbalances.46
Operating with safety margins also means regaining them once they are lost. This puts a premium on exit strategies. Experience indicates that rebuilding buffers can be hard. One reason has to do with incentives. Especially when emerging from a crisis, policymakers tend to tilt the balance of risks towards doing too much rather than too little, prolonging the support to the economy to nurture it back to health. This is entirely natural and can be quite compelling at any given decision point. That said, it maximises the probability that, looking back, policymakers will realise they have prolonged support for too long. Adopting and communicating exit strategies based on an explicit incorporation of safety margins in policy frameworks could help reduce this bias. If something is valuable, it is worth paying a price for it.
The importance of safety margins has specific implications for balance sheet policies. Retaining room for manoeuvre also means keeping central bank balance sheets as small and as riskless as possible, subject to delivering successfully on the central bank's mandate. Larger and riskier balance sheets have both economic and political economy costs. Thus, following this guideline would maximise the central bank's ability to expand the balance sheet in line with needs. More generally, it would also limit the footprint of the central bank in the economy, thereby reducing the institution's involvement in resource allocation and reducing the risk of inhibiting market functioning. Put differently, the balance sheet needs to be elastic, not large. Small size and low riskiness enhance this elasticity (Box D).
The feasibility of retaining safety margins can only be assessed in a global context. This is because of the influence of global financial conditions and the high sensitivity of exchange rates to them. In practice, it is hard for countries to operate with policy rates that deviate substantially from those prevailing in global markets. FX intervention provides only limited additional room for manoeuvre. The role of countries that are home to international currencies and have an outsize influence on global financial conditions is especially important.
Nimbleness
Retaining room for policy manoeuvre is of little value unless this room can be exploited quickly. Nimbleness is needed to respond to unexpected developments. Nimbleness means being able to change course at little cost. The various policy tools differ in this regard.
In addition to clarity in communication, nimbleness explains why central banks rightly prefer to adjust the policy stance through interest rates than shifts in balance sheets. Balance sheets take longer to shift and are harder to calibrate. Moreover, the corresponding adjustment costs are perceived as larger for reductions than increases: it is easier to use than to gain room for manoeuvre. Given the importance of safety margins, this provides an additional justification for having interest rates as the primary tool.
Nimbleness also raises the question of the appropriate use of forward guidance. Forward guidance does not constrain the ability to adjust to changing circumstances when it simply provides information about the central bank's reaction function. Conditional forward guidance has this character. By contrast, when forward guidance contains an element of perceived commitment to a particular policy path, a degree of constraint is inevitable. Deviating from such a commitment can weaken credibility and cause unwelcome market reactions.
This suggests limiting the use of forward guidance that contains elements of commitment. It explains why central banks routinely stress conditionality when communicating policy intentions. At the same time, experience shows that the perceived unconditional element in forward guidance is generally greater than intended. In part, this reflects financial market participants' natural tendency to translate conditions into points in calendar time – the basis for taking positions. Here, too, realism in ambition can help, suggesting limiting the degree of ambition in the deployment of the tool.
Complementary policies
Robustness, realism in ambition, safety margins and nimbleness are key for monetary policy to maintain stability and retain trust. But, in the end, other policies need to play their role, too. Otherwise, the trade-offs monetary policy faces become unmanageable. Sustainable macroeconomic and financial stability will remain beyond reach if fiscal expansions are disproportionate, the sustainability of fiscal positions is in doubt, or prudential policies – both microprudential and macroprudential – fail to strengthen the resilience of the financial system. There is a need for coherence across different policies. Moreover, as discussed in detail in last year's AER, ultimately a broad change of mindset is called for to dispel a deeply rooted "growth illusion" – a de facto excessive reliance on monetary and fiscal policy to drive growth. Only structural policies designed to strengthen the supply side of the economy can deliver higher sustainable growth.
Conclusion
Monetary policy has faced historically severe tests since the GFC. And it has delivered. This tumultuous period, as well as the deceptive tranquillity of the preceding Great Moderation, provide a number of lessons. Some of these confirm previous widely held beliefs; others nuance previous expectations; together, they help to better understand monetary policy's strengths and limitations. They can thus shed light on the challenges central banks could face in the future and on how monetary policy frameworks could be refined to address them most effectively.
Five lessons stand out. First, forceful monetary tightening can prevent inflation from transitioning to a high-inflation regime. Even if central banks may be slow in responding initially, they can succeed, provided they catch up quickly and display the necessary determination to finish the job. Second, forceful action, notably the deployment of the central bank balance sheet, can stabilise the financial system at times of stress and prevent the economy from falling into a tailspin, thereby eliminating a major source of deflationary pressures. Whenever the solvency of borrowers, financial or non-financial, is threatened, this requires government backstops. Third, exceptionally strong and prolonged monetary easing has limitations: it exhibits diminishing returns, it cannot by itself fine-tune inflation in a low-inflation regime, and it can generate unwelcome side effects. These include weakening financial intermediation and inducing resource misallocations, encouraging excessive risk-taking and the build-up of vulnerabilities, and raising economic and political economy challenges for central banks as their balance sheets balloon. Fourth, communication has become more complicated. This has reflected the multiplicity of instruments, the failure to anticipate the surge in inflation and, more generally, a growing expectations gap between what central banks can deliver and what they are expected to deliver. Finally, the experience of EMEs, in particular, has illustrated how the complementary deployment of FX intervention and macroprudential tools can help improve the trade-off between price and financial stability. Using the tools judiciously also requires a keen awareness of their limitations, especially in the case of FX intervention.
In the years ahead monetary policy may well face an equally challenging environment. The unsustainability of fiscal trajectories poses the biggest threat to monetary and financial stability. And supply may not be as elastic as in the decades preceding the pandemic due to changes in the degree of global integration, demographics and climate change. The world could become more inflation-prone. At the same time, a return to a world of more persistent disinflationary pressures cannot be ruled out, especially if the wave of technological advances under way bears fruit (Chapter III).
Against this backdrop, it would be desirable for monetary policy frameworks to pay particular attention to four aspects: robustness, realism in ambition, safety margins and nimbleness. Together, they can reduce the risk that monetary policy, just as fiscal policy, is relied upon excessively to drive growth – a growth illusion. All this means focusing on maintaining inflation within the region of price stability while safeguarding financial stability. This calls for forceful responses when a transition to a high-inflation regime threatens and greater tolerance for modest, even if persistent, shortfalls of inflation from narrowly defined targets. It means seeking to put in place policies that retain policy room for manoeuvre over successive business and financial cycles. It means putting a premium on exit strategies from extreme policy settings designed to stabilise the economy and on keeping balance sheets as small and riskless as possible, subject to effectively fulfilling mandates. It means avoiding overreliance on approaches that may unduly hinder flexibility, such as variants of forward guidance, critical dependencies on unobservable and highly model-specific concepts, or frameworks designed for seemingly invariant economic environments. It means working hard through communication to close the expectations gap. And it means retaining institutional arrangements that shield the central bank from political economy pressures which make it difficult to address tough intertemporal trade-offs, be these linked to inflation or the build-up of financial imbalances.
In the end, though, the trade-offs that monetary policy faces can become unmanageable absent more holistic and coherent policy frameworks in which other policies – prudential, fiscal or structural – play their part. Indeed, the growth illusion cannot be finally dispelled without a keener recognition that only structural policies can deliver higher sustainable growth.
Endnotes
1 While not always fully in charge of the deployment of macroprudential tools, central banks typically play a key role in the decision-making process, eg as a leading member of a financial stability council or committee.
2 Eickmeier and Hofmann (2022) and Shapiro (2022) provide evidence suggesting that the inflation surge was to a significant extent driven by strong demand, reflecting at least in part the effects of monetary and fiscal stimulus.
3 See BIS (2022) and Carstens (2022).
4 See Amatyakul et al (2023) and De Fiore et al (2023).
5 See BIS (2009, 2020) for a detailed analysis of the emergency measures deployed during the GFC and the Covid-19 crisis, respectively.
6 See eg Gagnon et al (2011), Joyce et al (2011), Krishnamurthy and Vissing-Jorgensen (2011), Bauer and Neely (2014), Neely (2015), Swanson (2015) and Altavilla et al (2021).
7 See CGFS (2020) for a comprehensive account of the role of the US dollar from an international perspective.
8 For the impact of swap lines during the GFC, see eg Baba and Packer (2009) and McGuire and von Peter (2009).
9 For the impact of swap lines on financial markets and cross-border flows during the Covid-19 crisis, see eg Avdjiev et al (2020), Eren et al (2020) and Aldasoro et al (2020). See also Bahaj and Reis (2022) for a theoretical and empirical analysis of international lender of last resort policies through swap lines.
10 See Eren and Wooldridge (2021), Aramonte et al (2022) and FSB (2022).
11 See BIS (2020) for a detailed account of the evolution of central bank lender of last resort policies into market-maker or buyer of last resort. See also Markets Committee (2022a) and CGFS (2023) for a related discussion.
12 See Arslan et al (2020).
13 See BIS (2009) and Alberola-Ila et al (2020) for a detailed account of fiscal policies during the GFC and the Covid-19 crisis, respectively.
14 See BIS (2023) for a detailed analysis of interlinkages between monetary and fiscal policies.
15 See Acharya et al (2023) for suggestive evidence on higher liquidity risks at commercial bank balance sheets in response to central bank balance sheet expansions.
16 See eg Bernanke (2002).
17 See Borio and Zabai (2016), CGFS (2019) and Cecchetti et al (2020) for a review of the evidence on the impact of unconventional monetary policy tools on economic activity. See also Markets Committee (2019) on the impact of large balance sheets on market functioning.
18 See eg Woodford (2012) and Bauer and Rudebusch (2014).
19 See also Group of Thirty (2023) and Rajan (2023) for a related discussion.
20 See also BIS (2016) for evidence on smaller announcement effects outside stress periods.
21 The higher bar for what constitutes a significant stimulus at the margin is a possible reason why several central banks, such as the Bank of Japan and the Reserve Bank of Australia, resorted to yield curve control policies. In this case, the central bank commits to a target for a given long-term interest rate and potentially reduces the need to increase the size of the balance sheet through this commitment (eg the Bank of Japan targeted the 10-year yield and the Reserve Bank of Australia targeted the three-year yield). See eg Hattori and Yoshida (2023) and Lucca and Wright (2022) for an analysis of yield curve control in Japan and Australia, respectively.
22 See Heider et al (2021) and Brandão-Marques et al (2024) for a literature review on the transmission of negative interest rates.
23 See Borio and Gambacorta (2017).
24 There is also evidence that LSAPs affect financial variables through other channels. Asset purchases had an impact also through the gross "flow" of purchases and the total "stock" absorbed by the central bank (or expected to be absorbed). In general, the stock effect had a larger and more persistent impact. However, the flow effect was often stronger during periods of acute market dysfunction and low market liquidity. See CGFS (2023) for a discussion of the channels through which LSAPs affect financial variables.
25 See Borio and Hofmann (2017) and the references therein.
26 See Ahmed et al (2024).
27 See Borio et al (2021) and Borio et al (2023).
28 For evidence on the impact of low rates on banks, pension funds and insurance companies, see eg Borio et al (2017b), Claessens et al (2018) and CGFS (2018). However, focusing on the euro area, Altavilla et al (2018) do not find a significant relationship between interest rates and bank profitability.
29 See Banerjee and Hofmann (2018) and the references therein for the empirical evidence.
30 See Grimm et al (2023) and Boyarchenko et al (2022).
31 See Du et al (2024).
32 Forward guidance can be distinguished along two dimensions. One relates to the period or circumstances under which the guidance applies. Specifically, forward guidance could apply to a particular period of time ("calendar-based") or be made conditional on economic developments ("state-contingent"). A second characteristic relates to the nature of the guidance, whether it provides specific numerical values ("quantitative") or is expressed in vaguer terms ("qualitative"). See Filardo and Hofmann (2014) and Borio and Zabai (2016) for detailed discussions.
33 See BIS (2021).
34 For a related analysis reviewing economic forecasting at the Bank of England, see Bernanke (2024).
35 See Blinder et al (2024) for a review of the literature on central bank communication with the public.
36 For evidence of the link between global financial conditions and capital flows to EMEs, see eg Ahmed and Zlate (2014) and Bräuning and Ivashina (2020). For evidence about the role of macroprudential regulation in dampening the impact of global financial shocks on EMEs, see Brandão-Marques et al (2021), Gelos et al (2022) and Bergant et al (2023).<
37 See BIS (2019) for a detailed discussion of monetary policy frameworks in EMEs and their evolution.
38 FX interventions can also affect the exchange rate through signalling and portfolio rebalancing channels. For a survey of the early literature, see Sarno and Taylor (2001). For recent theoretical contributions, see Gabaix and Maggiori (2015) and Cavallino (2019).
39 See eg Frankel (2019).
40 The financial channel of the exchange rate operates through the balance sheets of domestic borrowers borrowing foreign currency debt (original sin) and foreign lenders lending in local currency (original sin redux) (see Carstens and Shin (2019)). In both cases, currency appreciation embellishes balance sheets and enables greater borrowing or lending, which in turn reinforce currency appreciation (Hofmann et al (2020)). FX purchases depreciating the currency can therefore break this circle. The sterilisation leg of FX intervention can further mute credit expansion if banks are balance sheet constrained (Chang (2018)). See Hofmann et al (2019) for a simple model featuring both channels, and supportive evidence based on Colombian micro data.
41 The choice of FX intervention instruments and tactics depends on fundamental assessments of the benefits and costs of intervention, the specific objective and market conditions. For a more detailed discussion, see eg Patel and Cavallino (2019), BIS (2019), Adler et al (2021) and Markets Committee (2022b).
42 More generally, Blanchard et al (2015) find that FX intervention mitigates the impact of shifts in global capital flows on the economy.
43 See BIS (2023).
44 In this vein, survey evidence suggests that high public debt increases household inflation expectations, especially among people that have less confidence in the central bank's determination to fight inflation (Grigoli and Sandri (2023)).
45 For an in-depth analysis of the effects of monetary policy on inequality, see BIS (2021).
46 In addition, the concerns with the output costs of periods of falling goods and services prices ("deflation") may be overstated. The historical record points to only a weak association, presumably because of the relevance of benign supply factors. The link derives largely from the unique experience of the Great Depression (Goodhart and Hofmann (2007) and Borio et al (2015)). By contrast, the evidence suggests a closer link with asset price deflations, especially property price ones, which can go hand in hand with financial crises. See also Feldstein (2015) and Rajan (2015) who refer to the "deflation bogeyman".
Technical annex
Graph 1: Medians across AT, AU, BE, CA, CH, DE, DK, ES, FI, FR, GB, GR, IE, IT, JP, LU, NL, NO, NZ, PT, SE and US. Aggregates are computed using a smaller set of economies when data are not available.
Graph 1.B: The real policy rate is calculated by adjusting the nominal rate for inflation.
Graph 2: The lending corresponds to outstanding repos for the Federal Reserve and the Eurosystem; for the Federal Reserve, additionally, it includes term auction facilities, other loans and net portfolio holdings of the Commercial Paper Funding Facility; for the Bank of Japan, it consists of receivables under resale agreements and loans excluding those to the Deposit Insurance Corporation of Japan; for the Bank of England, short-term lending with one-week and other maturities within the maintenance period, as well as longer-term lending from fine-tuning repo operations, are included. For the Federal Reserve, securities include the face value of US Treasury securities, mortgage-backed securities and agency debt held outright; for the Bank of Japan, it corresponds to Japanese government and corporate bonds; and for the Bank of England, proceeds from gilt holdings of the Asset Purchase Facility. For the Eurosystem, it includes holdings of securities for monetary policy operations.
Graphs 3.A and 3.C: Asian EMEs = CN, HK, ID, IN, KR, MY, PH, SG, TH and VN; Latin America = AR, BR, CL, CO, MX and PE.
Graph 3.A: Median annual inflation across economies within each region, simple average for each period. Identification and classification of crises are based on Laeven and Valencia (2020). Crises include currency crises, sovereign debt crises, sovereign debt restructuring and systemic banking crises.
Graph 3.B: EMEs = BR, CL, CO, CZ, HU, ID, IN, KR, MX, PE, PH, PL, RU, TH, TR and ZA. The sample covers inflation targeting economies only. Net capital inflow is the sum of direct, portfolio and other investments, excluding reserves and related items.
Graph 3.C: For the FX reserves, EA consolidated values are reported; for the macroprudential policies, EA member states' values are reported. Other EMEs = AE, CZ, DZ, HU, IL, KW, MA, PL, RO, RU, SA, TR and ZA. EMEs = Asian EMEs + Latin America + other EMEs.
Graph 4.A: The sample covers AU, BE, CA, DE, DK, ES, FR, GB, IE, IT, JP, NL, SE and US; from Q1 1960 to Q3 2023, subject to data availability. Sensitivity of wages to prices estimates are computed at quarterly frequency based on a wage equation, in which nominal wage growth at time t + 4 is regressed on inflation and its interaction with the high-inflation regime dummy as well as on the unemployment gap, productivity growth at time t and country and time fixed effects. High- and low-inflation regime estimates are computed for pre- and post-1990, respectively. Sensitivity of prices to wages estimates are computed at quarterly frequency based on a wage equation, in which inflation at time t + 4 is regressed on nominal wage growth and its interaction with the high-inflation regime dummy as well as on the unemployment gap and productivity growth at time t and country and time fixed effects. High-inflation regime is defined as the periods in which the eight-quarter moving median of past core inflation is above 5%.
Graph 4.B: Similarity index based on Mink et al (2007), modified by adding one so that it lies in the range between zero and one. The reference rate used in the computation of the similarity index is the unweighted cross-sectional median of sectoral prices. The sample covers AEs = AT, BE, CA, CH, DE, DK, ES, FI, FR, GB, IE, IT, JP, NL, NO, PT, SE and US; EMEs = BR, CL, CO, CZ, HU, KR, MX, PE, PL, RO, SG and TR for the period from January 1950 to April 2024, subject to data availability. Twelve-month headline inflation is shown on a logarithmic scale. Total number of sectors per economy range from 11 to 205.
Graph 5.A: The model is calibrated on US data, see Hofmann et all (2021) for details. The shock is a 3 percentage point increase in inflation with persistence of 0.6. With monetary tightening, monetary policy follows a standard inertial Taylor rule, and without tightening, the monetary policy rates stay unchanged.
Graph 5.B: Simple average across AT, AU, BE, CA, CH, DE, DK, ES, FI, FR, GB, GR, IE, IT, JP, LU, NL, NO, NZ, PT, SE and US. The starting dates of the inflation surges are January 1973 and July 2021.
Graph 6.A: For sovereign CDS, simple average across AU, CA, CH, DE, DK, ES, FR, GB, IT, JP, NO, NZ and US. For bank CDS, simple average across an unbalanced sample of 82 banks in the same sample of economies. CDS with maturity of five years, priced in US dollars, subject to data availability. VIX = Chicago Board Options Exchange (CBOE) Volatility Index.
Graph 6.B: Libor = London interbank offered rate.
Graph 7.A: Libor = London interbank offered rate. OIS = overnight indexed swap. A1/P1 CP = highest-rated commercial papers with a maturity of less than 270 days. T-bill = Treasury bill. Announcements = 7 October 2008 for GFC (the establishment of the Commercial Paper Funding Facility) and 23 March 2020 for Covid-19 (Federal Reserve announcement of extensive new measures).
Graph 7.B: High-yield (HY) and investment grade (IG) refer to ICE BofA option-adjusted corporate bond spreads. Italy and Spain sovereign spread over 10-year German sovereign yields.
Graph 7.C: Responses to EME central banks' bond purchase announcements in 2020 calculated as the cumulative changes relative to the day prior to the announcement. Simple average of the responses for announcements that did not coincide with interest rate changes in CL, CO, ID, IN, KR, PH, TH, TR and ZA. See Arslan et al (2023) for details.
Graph 8: The sample covers AU, BE, CA, CH, DE, DK, ES, FI, FR, GB, IE, IT, JP, NL, NO, NZ, SE and US for the period between Q1 1985 and Q4 2019. Threshold for the low interest rate regime is 2.25%, chosen to maximise empirical fit using grid-search procedures. Derived using a non-linear empirical model based on the local projection method to estimate the interest elasticity of aggregate demand. The model includes control variables: CPI, exchange rates, stock prices, real house prices, long-term interest rates and household debt ratios. Non-linearity is introduced through indicator variables differentiating between high and low interest rate regimes, high- and low-debt regimes, and expansionary and recessionary regimes. An economy is classified as being in a high-debt regime when its credit gap is in the top 25th percentile of its distribution. Classification of downturn is based on the recession dates identified by the OECD. See Ahmed et al (2024) for details.
Graph 9: Based on the US price index of personal consumption expenditures (PCE) data. The common inflation component in panels A and B is defined as the first principal component of monthly log changes of 131 PCE categories. The share of variance explained by the common component in panel A is estimated over a 15-year moving window. The sample used in estimations in panels B and C covers data from July 1992 to December 2019. The idiosyncratic component of sectoral log price changes in panel C corresponds to the residuals from the regression of monthly sector-specific log price changes on the common component. Panel C shows the proportion of price decreases that are statistically significant at the 5% level. See Borio et al (2023) for details.
Graph 10.A: The sample covers 3,520 banks in AT, AU, BE, BR, CH, CN, CZ, DE, DK, ES, FI, FR, GB, HK, HU, IN, IT, JP, KR, MX, NL, NO, PH, PL, RO, RU, SE, SG, TH, TR, US and ZA.
Graph 10.B: The sample covers 13 large life insurance companies (ICs) in CA, CH, FR, GB, JP, NL and US. For excess return, asset-weighted average of cumulative equity returns relative to the domestic stock market since 6 January 2014. Average government bond yield is the asset-weighted average of the 10-year government bond yields prevailing in the home jurisdictions of the ICs.
Graph 10.C: The sample covers AU, BE, CA, CH, DE, DK, ES, FR, GB, IT, JP, NL, SE and US. A firm is classified as a zombie if the following conditions are met over two years: (i) earnings before interest and taxes (EBIT) is less than interest payments and (ii) the ratio of the market value of its assets to replacement cost (Tobin's q) is below the median within its sector. To exit from the zombie status, a firm needs to have an EBIT greater than interest payments or a Tobin's q above the median for two consecutive years before it is declassified from the status. The nominal policy rate is the simple average across the sample economies.
Graph 11: Projections are based on exit plans announced up to May 2024. For the Bank of England, Federal Reserve and Sveriges Riksbank, projections assume a reduction in assets of respectively GBP 100 billion per year (GBP 8.33 billion per month), USD 60 billion per month and SEK 6.5 billion per month. For the Reserve Bank of Australia and Bank of Canada, projections assume no reinvestment of maturing securities. For the Eurosystem, the projection assumes no reinvestment of maturing securities of the asset purchase programme (APP), a reduction in assets of EUR 7.5 billion per month of the pandemic emergency purchase programme (PEPP) and considers maturing open market operations.
Graph 12.A: EMBI = JPMorgan Emerging Markets Bond Index Global, yield to maturity.
Graph 12.B: Actual headline inflation less one-year-ahead (or closest) inflation forecast of the respective central bank. For the Federal Reserve, midpoint of the central tendency for the personal consumption expenditures inflation rate in the Federal Open Market Committee's summary of economic projections. For the ECB, Eurosystem and ECB staff macroeconomic projections for the harmonised index of consumer prices (HICP). For the Bank of England, the Monetary Policy Committee's median CPI inflation projection assuming that rates will follow the market expectation of interest rates.
Graph 12.C: All speeches of central bankers mentioning the keyword "inequality" expressed as a share of all central bankers' speeches in the BIS database (www.bis.org/cbspeeches/index.htm). Only selected speeches in English and, for the United States, only speeches by members of the Board of Governors of the Federal Reserve System and the Federal Reserve Bank of New York are included in the database.
Graph 13.A: The sample covers AR, BR, CL, CN, CO, CZ, HU, ID, IN, KR, MX, MY, PE, PH, PL, RU, SG, TH, TR, TW and ZA. For the taper tantrum, FX reserves as of 2012 and depreciation against the US dollar from Q1 2013 to Q4 2015; for Covid-19, reserves as of 2019 and depreciation from January to March 2020; and for the inflation surge, reserves as of Q2 2021 and depreciation against the US dollar from Q3 2021 to Q2 2022.
Graph 13.B: FX purchase: change of FX reserve as a percentage of nominal GDP in US dollars; capital inflow: net capital flows as a percentage of nominal GDP in US dollars; exchange rate appreciation: log change in bilateral FX rate against the US dollar. The sample covers BR, CL, CN, CO, CZ, HK, HU, ID, IN, KR, MX, MY, PE, PH, PL, RU, SG, TH, TR and ZA from Q3 2000 to Q1 2024. The control variables comprise the lagged dependent variables, the short-term interest rate spread against the US equivalent, the log change in the Chicago Board Options Exchange Volatility Index (VIX) and the Commodity Research Bureau (CRB) commodity price index, dummy for the Great Financial Crisis and country fixed effects.
Graph 14: The sample covers 157 monetary tightening episodes for AT, AU, BE, CA, CH, CL, CO, CZ, DE, DK, ES, FI, FR, GB, GR, HK, HU, IL, IN, IS, IT, JP, KR, LU, LV, MX, NL, NO, NZ, PE, PL, PT, RO, SK, TH, TW and US. Capital measures include prudential measures taken to strengthen banks' capital positions, such as minimum capital ratios, adjustments in risk weights and limits on bank leverage. See Boissay et al (2023) for details.
Graph 15: The sample covers AEs = AT, BE, DE, ES, FI, FR, GB, IE, IT, JP, NL, PT and US. EMEs = AR, BR, CL, CN, CO, CZ, HU, ID, IL, IN, KR, MX, PL and ZA. Aggregates are computed using a smaller set of economies when data are not available.
Graphs 15.A and 15.B: Projections assume an interest rate growth differential equal to –1%; constant primary fiscal deficit as a percentage of GDP as of 2023; and increases in pension and healthcare spending based on IMF projections for 2030 and 2050. Simple average across economies.
Graph 15.C: Median across economies. Counterfactuals are computed by multiplying end-2023 public debt-to-GDP ratios by the average of short- and long-term interest rates. Interest rates are based on the levels as of May 2024 (for the scenario under which rates remain at current levels) or at the levels prevailing in 1995.
References
Acharya, V, R Chauhan, R Rajan and S Steffen (2023): "Liquidity dependence and the waxing and waning of central bank balance sheets", NBER Working Papers, no 31050.
Adler, G, K S Chang, R Mano and Y Shao (2021): "Foreign exchange intervention: a dataset of public data and proxies", IMF Working Papers, no 47, February.
Afonso, G, D Giannone, G La Spada and J Williams (2024): "Scarce, abundant, or ample? A time-varying model of the reserve demand curve", Federal Reserve Bank of New York Staff Reports, no 1019.
Ahmed, R, C Borio, P Disyatat and B Hofmann (2024): "Losing traction? The real effects of monetary policy when interest rates are low", Journal of International Money and Finance, vol 141, March.
Ahmed, S and A Zlate (2014): "Capital flows to emerging market economies: a brave new world?", Journal of International Money and Finance, vol 48, November.
Alam, Z, A Alter, J Eiseman, G Gelos, H Kang, M Narita, E Nier and N Wang (2019): "Digging deeper – evidence on the effects of macroprudential policies from a new database", IMF Working Papers, no 66, March.
Alberola-Ila, E, Y Arslan, G Cheng and R Moessner (2020): "The fiscal response to the Covid-19 crisis in advanced and emerging market economies", BIS Bulletin, no 23, June.
Aldasoro, I, T Ehlers, P McGuire and G von Peter (2020): "Global banks' dollar funding needs and central bank swap lines", BIS Bulletin, no 27, July.
Altavilla, C, M Boucinha and J L Peydro (2018): "Monetary policy and bank profitability in a low interest rate environment", Economic Policy, vol 33, no 96, pp 531–86.
Altavilla, C, G Carboni and R Motto (2021): "Asset purchase programs and financial markets: lessons from the euro area", International Journal of Central Banking, vol 70.
Amatyakul, P, F De Fiore, M Lombardi, B Mojon and D Rees (2023): "The contribution of monetary policy to disinflation, BIS Bulletin, no 82, December.
Aramonte, S, A Schrimpf and H S Shin (2021): "Non-bank financial intermediaries and financial stability", BIS Working Papers, no 972, October.
Arslan, Y, M Drehmann and B Hofmann (2020): "Central bank bond purchases in emerging market economies", BIS Bulletin, no 20, June.
Avdjiev, S, E Eren and P McGuire (2020): "Dollar funding costs during the Covid19 crisis through the lens of the FX swap market", BIS Bulletin, no 1, April.
Baba, N and F Packer (2009): "Interpreting deviations from covered interest parity during the financial market turmoil of 2007–08", Journal of Banking and Finance, vol 33, no 11, pp 1953–62.
Bahaj, S and R Reis (2022): "Central bank swap lines: evidence on the effects of the lender of last resort", Review of Economic Studies, vol 89, no 4, pp 1654–93.
Banerjee, R and B Hofmann (2018): "The rise of zombie firms: causes and consequences", BIS Quarterly Review, September, pp 67–78.
----- (2022): "Corporate zombies: anatomy and life cycle", Economic Policy, vol 37, no 112, October, pp 757–803.
Bank for International Settlements (BIS) (2009): "Policy responses to the crisis", 79th Annual Report, June, Chapter VI.
----- (2016): "Monetary policy: more accommodation, less room", Annual Economic Report 2016, June, Chapter IV.
----- (2019): "Monetary policy frameworks in EMEs: inflation targeting, the exchange rate and financial stability", Annual Economic Report 2019, June, Chapter II.
----- (2020): "A monetary lifeline: central banks' crisis response", Annual Economic Report 2020, June, Chapter II.
----- (2021): "The distributional footprint of monetary policy", Annual Economic Report 2021, June, Chapter II.
----- (2022): "Inflation: a look under the hood", Annual Economic Report 2022, June, Chapter II.
----- (2023): "Monetary and fiscal policies: safeguarding stability and trust", Annual Economic Report 2023, June, Chapter II.
Bank of England (2021): "The MPC's strategy for the mix of monetary policy instruments to deliver tighter policy", Monetary Policy Report, August, Box A.
Bauer, M and C Neely (2014): "International channels of the Fed's unconventional monetary policy", Journal of International Money and Finance, vol 44, pp 24–46.
Bauer, M and G Rudebusch (2014): "The signaling channel for Federal Reserve bond purchases", International Journal of Central Banking, vol 10, no 3, pp 233–89.
Bell, S, M Chui, T Gomes, P Moser-Boehm and A Tejada (2023): "Why are central banks reporting losses? Does it matter?" BIS Bulletin, no 68, February.
Bell, S, J Frost, B Hofmann, D Sandri and H S Shin (2024): "Central bank capital and trust in money: lessons from history for the digital age", BIS Papers, no 146.
Benigno, G, B Hofmann, G Nuño and D Sandri (2024): "Quo vadis, r*? The natural rate of interest after the pandemic", BIS Quarterly Review, March, pp 17–30.
Bergant, K, F Grigoli, N Hansen and D Sandri (2023): "Dampening global financial shocks: can macroprudential regulation help (more than capital controls)?", BIS Working Papers, no 1097, May.
Bernanke, B (2002): "Deflation: making sure it doesn't happen here", speech before the National Economists Club, Washington, DC, 21 November.
-----(2024): Forecasting for monetary policy making and communication at the Bank of England: a review, Bank of England, April.
Blanchard, O, G Adler and I de Carvalho Filho (2015): "Can foreign exchange intervention stem exchange rate pressures from global capital flow shocks?", NBER Working Papers, no 21427, July.
Blinder, A, M Ehrmann, J de Hann and D-J Jansen (2024): "Central bank communication with the general public: promise or false hope?", Journal of Economic Literature, forthcoming.
Board of Governors of the Federal Reserve Board (2022): Principles for reducing the size of the Federal Reserve's balance sheet, www.federalreserve.gov/monetarypolicy/policy-normalization.htm.
Boissay, F, C Borio, C Leonte and I Shim (2023): "Prudential policy and financial dominance: exploring the link", BIS Quarterly Review, March, pp 15–31.
Borio, C (1995): "Payment and settlement systems: trends and risk management", in G Kaufman (ed), Research in Financial Services: Public and Private Policy, Greenwich: JAI Press Inc, vol 7, pp 87–110.
--- (2023): "Getting up from the floor", remarks at De Nederlandsche Bank workshop "Beyond unconventional policy: implications for central banks' operational frameworks", 10 March.
Borio, C and P Disyatat (2014): "Low interest rates and secular stagnation: is debt a missing link?", VoxEU, 25 June.
Borio, C, P Disyatat, M Juselius and P Rungcharoenkitkul (2017a): "Why so low for so long? A long-term view of real interest rates", BIS Working Papers, no 685, December.
Borio, C, P Disyatat, M Juselius and P Rungcharoenkitkul (2022): "Why so low for so long? A long-term view of real interest rates", International Journal of Central Banking, vol 18, no 3, pp 47–87.
Borio, C, P Disyatat and A Schrimpf (2024): "The double-faced demand for bank reserves and its implications", VoxEU, 15 February.
Borio, C, P Disyatat, D Xia and E Zakrajšek (2021): "Monetary policy, relative prices and inflation control: flexibility born out of success", BIS Quarterly Review, September, pp 15–29.
Borio, C, M Erdem, A Filardo and B Hofmann (2015): "The costs of deflations: a historical perspective", BIS Quarterly Review, March, pp 31–54.
Borio, C and L Gambacorta (2017): "Monetary policy and bank lending in a low interest rate environment: diminishing effectiveness?", BIS Working Papers, no 612, February.
Borio, C, L Gambacorta and B Hofmann (2017b): "The influence of monetary policy on bank profitability", International Finance, vol 20, no 1, pp 48–63.
Borio, C and B Hofmann (2017): "Is monetary policy less effective when interest rates are persistently low?", BIS Working Papers, no 628, April.
Borio, C, M Lombardi, J Yetman and E Zakrajšek (2023): "The two-regime view of inflation", BIS Papers, no 133, March.
Borio, C and A Zabai (2016): "Unconventional monetary policies: a re-appraisal", BIS Working Papers, no 570, July.
Boyarchenko, N, G Favara and M Schularick (2022): "Financial stability considerations for monetary policy: empirical evidence and challenges", Federal Reserve Board Finance and Economics Discussion Series, no 6.
Brandão-Marques, L, M Casiraghi, G Gelos, G Kamber and R Meeks (2024): "Negative interest rate policies: a survey", Annual Review of Economics, vol 16.
Brandão-Marques, L, G Gelos, M Narita and E Nier (2021): "Leaning against the wind: an empirical cost-benefit analysis", CEPR Discussion Papers, no 15693.
Bräuning, F and V Ivashina (2020): "US monetary policy and emerging market credit cycles", Journal of Monetary Economics, vol 112, pp 57–76.
Caputo, R and D Saravia (2021): "The monetary and fiscal history of Chile: 1960–2016", in T Kehoe and J P Nicolini (eds), A monetary and fiscal history of Latin America, 1960–2017, University of Minnesota Press.
Carstens, A (2022): "The return of inflation", speech at the International Center for Monetary and Banking Studies, Geneva, 5 April.
----- (2023): "Central banks are not here to make profits", Financial Times, 7 February.
Carstens, A and H S Shin (2019): "Emerging markets aren't out of the woods yet", Foreign Affairs, 15 March.
Cavallino, P (2019): "Capital flows and foreign exchange intervention", American Economic Journal: Macroeconomics, vol 11, no 2, pp 127–70.
Cecchetti, S, M Feroli, A Kashyap, C Mann and K Schoenholtz (2020): "Monetary policy in the next recession?", CEPR Discussion Papers, no 15365.
Cesa-Bianchi, A, R Harrison and R Sajedi (2023): "Global r*", Bank of England Staff Working Papers, no 990, July.
Chang, R (2018): "Foreign exchange intervention redux", NBER Working Papers, no 24463, March.
Christensen, J and G Rudebusch (2012): "The response of interest rates to US and UK quantitative easing", Economic Journal, vol 122, no 564, pp 385–414.
Claessens, S, N Coleman and M Donnelly (2018): "'Low-for-long' interest rates and banks' interest margins and profitability: cross-country evidence", Journal of Financial Intermediation, vol 35, pp 1–16.
Committee on the Global Financial System (CGFS): (2018): "Financial stability implications of a prolonged period of low interest rates", CGFS Papers, no 61, July.
----- (2019): "Unconventional monetary policy tools: a cross-country analysis", CGFS Papers, no 63, October.
-----(2020): "US dollar funding: an international perspective", CGFS Papers, no 65, June.
----- (2023): "Central bank asset purchases in response to the Covid-19 crisis", CGFS Papers, no 68, March.
De Fiore, F, B Mojon, D Rees and D Sandri (2023): "Monetary policy frameworks away from the ELB", BIS Working Papers, no 1156, December.
Del Negro, M, D Giannone, M Giannoni and A Tambalotti (2017): "Safety, liquidity, and the natural rate of interest", Brookings Papers on Economic Activity, vol 48, pp 235–316.
Disyatat, P and C Borio (2021): "Monetary and fiscal policies: in search of a corridor of stability", VoxEU, 10 November.
Du, W, K Forbes and M Luzzetti (2024): "Quantitative tightening around the globe: what have we learned?", paper presented at the 2024 US Monetary Policy Forum.
Duarte, J and T Umar (2024): "Identifying the effects of demand for safe assets", SSRN, February.
Duca-Radu, I and S Testi (2021): "Liquidity usage in TARGET2", European Central Bank Economic Bulletin, no 3.
Eickmeier, S and B Hofmann (2022): "What drives inflation? Disentangling demand and supply factors", BIS Working Papers, no 1047, November.
Eren, E, A Schrimpf and V Sushko (2020): "US dollar funding markets during the Covid-19 crisis – the international dimension", BIS Bulletin, no 15, May.
Eren, E, A Schrimpf and D Xia (2023): "The demand for government debt", BIS Working Papers, no 1105, June.
Eren, E and P Wooldridge (2021): "Non-bank financial institutions and the functioning of government bond markets", BIS Papers, no 119, November.
Feldstein, M (2015): "The deflation bogeyman", Project Syndicate, 25 February.
Filardo, A and B Hofmann (2014): "Forward guidance at the zero lower bound", BIS Quarterly Review, March, pp 37–53.
Financial Stability Board (FSB) (2022): Global monitoring report on nonbank financial intermediation 2022, December.
Frankel, J (2019): "Systemic managed floating", Open Economies Review, vol 30, pp 255–95.
Gabaix, X and M Maggiori (2015): "International liquidity and exchange rate dynamics", Quarterly Journal of Economics, vol 130, no 5, pp 1369–420.
Gagnon, E, B Johannsen and D López-Salido (2021): "Understanding the new normal: the role of demographics", IMF Economic Review, vol 69, pp 357–90.
Gagnon, J, M Raskin, J Remache and B Sack (2011): "The financial market effects of the Federal Reserve's large-scale asset purchases", International Journal of Central Banking, vol 7, no 1, pp 3–43.
Gelos, G, L Gornicka, R Koepke, R Sahay and S Sgherri (2022): "Capital flows at risk: taming the ebbs and flows", Journal of International Economics, vol 134, 103555.
Goodhart, C and B Hofmann (2007): House prices and the macroeconomy: implications for banking and price stability, Oxford University Press, 1 March.
Grigoli, F and D Sandri (2023): "Public debt and household inflation expectations", BIS Working Papers, no 1082, March.
Grimm, M, O Jordà, M Schularick and A Taylor (2023): "Loose monetary policy and financial instability", NBER Working Papers, no 30958, February.
Group of Thirty (2023): Central banking and monetary policy: principles and the way forward.
Hamilton, J, E Harris, J Hatzius and K West (2016): "The equilibrium real funds rate: past, present and future", IMF Economic Review, vol 64, no 4, pp 660–707.
Hampl, M and T Havránek (2018): "Central bank financial strength and inflation: a meta-analysis", Czech National Bank Research and Policy Notes, no 1.
Hattori, T and J Yoshida (2023): "Yield curve control", International Journal of Central Banking, vol 19, no 5, pp 403–38.
Hauser, A (2023): "Less is more or less is a bore? Re-calibrating the role of central bank reserves", speech at King's College London's "Bank of England Watchers' Conference", London, November.
Heider, F, F Saidi and G Schepens (2021): "Banks and negative interest rates", Annual Review of Financial Economics, vol 13, pp 201–18.
Hofmann, B, M Lombardi, B Mojon and A Orphanides (2021): "Fiscal and monetary policy interactions in a low interest rate world", BIS Working Papers, no 954, July.
Hofmann, B, I Shim and H S Shin (2020): "Bond risk premia and the exchange rate", Journal of Money, Credit and Banking, vol 52, pp 497–520.
Hofmann, B, H S Shin and M Villamizar-Villegas (2019): "FX intervention and domestic credit: evidence from high-frequency micro data", BIS Working Papers, no 774, March.
Holston, K, T Laubach and J Williams (2023): "Measuring the natural rate of interest after Covid-19", Federal Reserve Bank of New York Staff Reports, no 1063, June.
Hördahl, P and O Tristani (2014): "Inflation risk premia in the euro area and the United States", International Journal of Central Banking, vol 10, no 3, pp 1–47.
International Monetary Fund (IMF) (2023): "The natural rate of interest: drivers and implications for policy", World Economic Outlook, April, Chapter 2.
Joyce, M, A Lasaosa, I Stevens and M Tong (2011): "The financial impact of quantitative easing in the United Kingdom", International Journal of Central Banking, vol 7, no 3, pp 113–61.
Kashyap, A and J Stein (2023): "Monetary policy when the central bank shapes financial-market sentiment", Journal of Economic Perspectives, vol 37, no1, pp 53–76.
Kearns, J, A Schrimpf and D Xia (2023): "Explaining monetary spillovers: the matrix reloaded", Journal of Money, Credit and Banking, vol 55, pp 1535–68.
Krishnamurthy, A and A Vissing-Jorgensen (2011): "The effects of quantitative easing on interest rates: channels and implications for policy", Brookings Papers on Economic Activity, vol 43, no 2, pp 215–87.
Laeven, L and F Valencia (2020): "Systemic banking crises database II", IMF Economic Review, vol 68, pp 307–61.
Logan, L (2024): "Discussion of Quantitative tightening around the globe: what have we learned? by Wenxin Du, Kristin Forbes and Matthew Luzzetti", speech at the 2024 US monetary policy forum, March.
Lubik, T and C Matthes (2015): "Calculating the natural rate of interest: a comparison of two alternative approaches", Federal Reserve Bank of Richmond Economic Briefs, no 10.
Lucca, D and J Wright (2022): "The narrow channel of quantitative easing: evidence from YCC down under", Federal Reserve Bank of New York Staff Reports, no 1013.
Lunsford, K and K West (2019): "Some evidence on secular drivers of US safe real rates", American Economic Journal: Macroeconomics, vol 11, no 4, pp 113–39.
Maechler, A and T Moser (2022): "Return to positive interest rates: why reserve tiering?", speech at Money Market Event, Geneva, 17 November.
Markets Committee (2019): "Large central bank balance sheets and market functioning", Markets Committee Papers, no 11, October.
----- (2022a): "Market dysfunction and central bank tools", Markets Committee Papers, May.
----- (2022b): "FX interventions", Markets Committee Papers, May.
McGuire, P and G von Peter (2009): "The US dollar shortage in global banking", BIS Quarterly Review, March, pp 47–63.
Mian, A, L Straub and A Sufi (2021): "Indebted demand", Quarterly Journal of Economics, vol 136, no 4, pp 2243–307.
Mink, M, J Jacobs and J de Haan (2007): "Measuring synchronicity and co-movement of business cycles with an application to the euro area", CESifo Working Papers, no 2112, October.
Neely, C (2015): "Unconventional monetary policy had large international effects", Journal of Banking and Finance, vol 52, pp 101–11.
Nordström, A and A Vredlin (2022): ''Does central bank equity matter for monetary policy?" Sveriges Riksbank Staff Memo, December.
Patel, N and P Cavallino (2019): "FX intervention: goals, strategies and tactics", BIS Papers, no 104.
Rajan, R (2015): Panel remarks at the IMF conference on "Rethinking macro policy III", Washington DC, 15–16 April.
----- (2023): "For central banks, less is more", Finance and Development, March.
Rogoff K, B Rossi and P Schmelzing (2022): "Long-run trends in long-maturity real rates 1311–2021", NBER Working Papers, no 30475.
Sarno, L and M Taylor (2001): "Official intervention in the foreign exchange market: is it effective and, if so, how does it work?", Journal of Economic Literature, vol 39, no 3, pp 839–68.
Schnabel, I (2023): "Quantitative tightening: rationale and market impact", speech at the Money Market Contact Group meeting, Frankfurt am Main, 2 March.
----- (2024): "The Eurosystem's operational framework", speech at the Money Market Contact Group meeting, Frankfurt am Main, 14 March.
Selgrad, J (2023): "Testing the portfolio rebalancing channel of quantitative easing", mimeo.
Shapiro, A (2022): "Decomposing supply and demand driven inflation", Federal Reserve Bank of San Francisco Working Papers, no 18, October.
Swanson, E (2015): "Measuring the effects of unconventional monetary policy on asset prices", NBER working papers, no 21816.
----- (2021): "Measuring the effects of Federal Reserve forward guidance and asset purchases on financial markets", Journal of Monetary Economics, vol 118, pp 32–53.
Taylor, J (1993): "Discretion versus policy rules in practice", Carnegie-Rochester Conference Series on Public Policy, vol 39, pp 195–214.
Wicksell, K (1898): Interest and prices: a study of the causes regulating the value of money, translation from German by R Kahn (1936).
Woodford, M (2012): "Methods of policy accommodation at the interest-rate lower bound", paper presented at the Federal Reserve Bank of Kansas City Jackson Hole symposium.