III. The financial sector: post-crisis adjustment and pressure points
Abstract
The Basel III reforms have been completed, ending a key part of the post-crisis regulatory overhaul. The favourable economic outlook provides a window of opportunity for banks to finalise their post-crisis adjustment. Meanwhile, non-bank intermediaries have been gaining ground, creating new pressure points in financial markets. Prompt and consistent implementation of all Basel III standards, along with tight regulation and supervision of both banks and non-banks, remains a policy priority.
Full text
The Basel III reforms are finalised, completing a key part of the regulatory overhaul in the wake of the Great Financial Crisis (GFC). Given the favourable near-term economic outlook (Chapter I) and the prevailing easy financial conditions even as monetary policies are gradually tightened (Chapter II), the window of opportunity is wide open - for most banks - to finalise their adjustment to the post-crisis environment. Substantial progress has already been made, with most banks meeting the more stringent capital requirements and new liquidity standards. Yet compressed equity valuations indicate that banks' efforts to fully reap the benefits of the reforms and ensure sustainable profitability are not yet complete. Meanwhile, non-bank intermediaries have been gaining ground, pointing to important structural trends in financial markets that bear on market dynamics, particularly under stress. This calls for prompt and consistent implementation of all Basel III standards, along with tight regulation and supervision of both banks and non-banks, to guard against risks that may have built up during past years of unusually low interest rates and compressed volatility.
This chapter starts with a review of the rationale and key elements of the Basel III reforms, including the final package agreed in December 2017. It then discusses Basel III implementation and banks' adjustment to the post-crisis environment, highlighting areas that warrant attention. The last section examines changing bank/non-bank interactions and their impact on market dynamics under stress.
Basel III: key elements of the completed framework
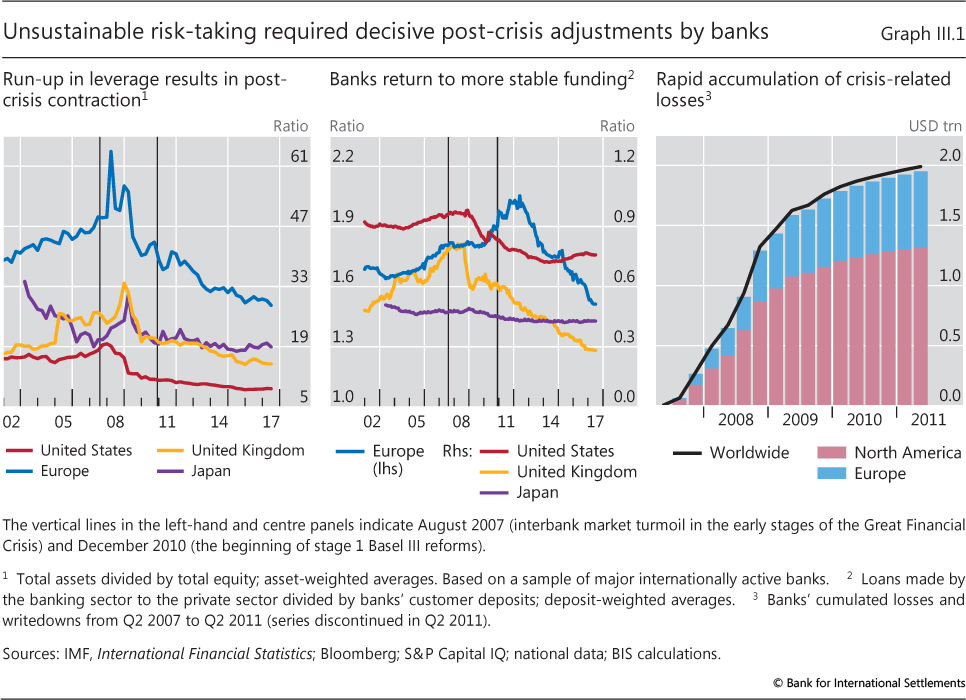
The GFC laid bare the vulnerabilities of the international banking system. Major banks entered the crisis with excessive, mismeasured levels of leverage and insufficiently stable funding sources. Crisis-related losses accumulated rapidly, contagiously spreading across markets and countries, and forcing public sector intervention. What started as strains in US subprime mortgage markets turned into a full-blown financial crisis (Graph III.1).
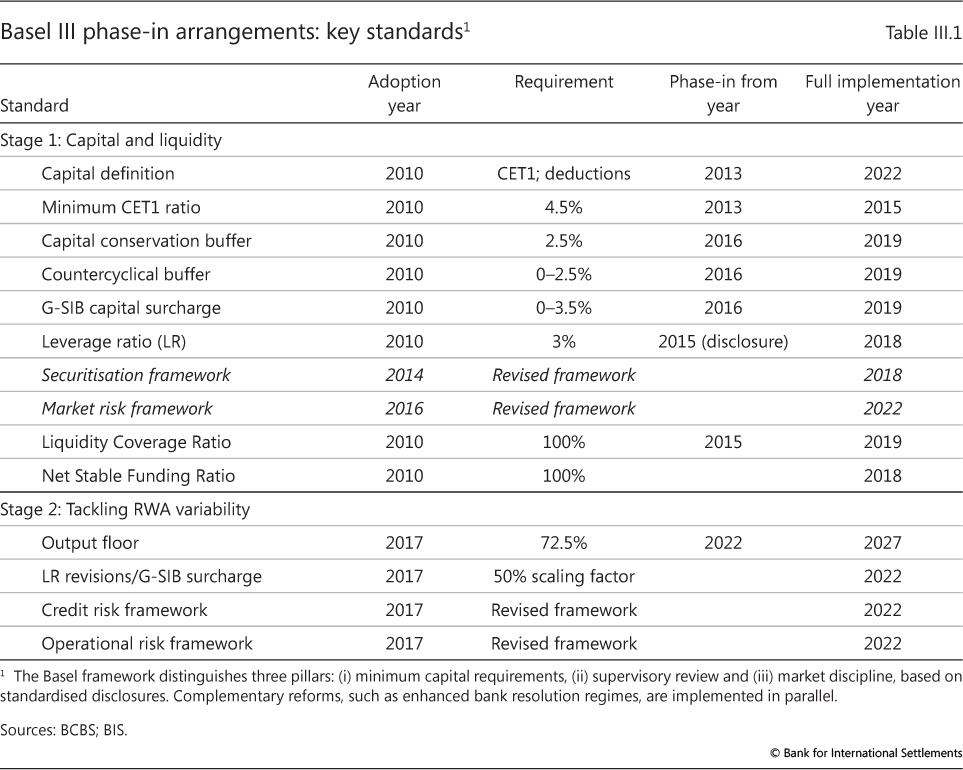
Ten years on, the post-crisis reforms of the regulatory framework for internationally active banks - Basel III - have been completed.1 In addressing the previous framework's weaknesses, the reforms have taken a two-stage approach (Table III.1). Stage 1, beginning in 2010, focused primarily on raising the size and quality of banks' capital buffers, while enhancing the robustness of the existing risk-weighted capital requirements (RWRs) through new capital and liquidity constraints. Stage 2 focused on the comparability and reliability of the internal model-based parts of the RWR framework, which allow banks to calculate their own risk weights. Most of the Basel III elements will be fully implemented as of 2022. Other reforms, such as minimum requirements for global systemically important banks' (G-SIBs') total loss-absorbing capacity, enhanced bank resolution regimes and the central clearing of all standardised derivatives contracts, are being implemented in parallel.2
Stage 1 reforms: raising bank capital and liquidity buffers
A key concern behind the Basel III stage 1 reforms was insufficient loss-absorbing capital buffers (Graph III.1, left-hand panel). The Basel I standards had established minimum capital requirements through ratios that weighted assets by their riskiness - risk-weighted assets (RWAs): the higher the measured riskiness, the higher the weight. Then, under Basel II, in order to improve this risk sensitivity, banks had been given the option - subject to supervisory approval - to set the risk weights themselves through their own internal risk models, such as the internal ratings-based (IRB) approach for credit risk. Alternatively, they could apply the simpler risk weights set by supervisors - under the so-called standardised approaches (SAs).
In response to the crisis, the stage 1 reforms substantially tightened the definition and quality of bank capital as well as the required minimum capital ratio. Banks now had to comply with a minimum ratio of 4.5% of RWAs, defined in terms of a stricter Common Equity Tier 1 (CET1) capital definition, and a 6% Tier 1 capital ratio. They also had to maintain an additional CET1 capital conservation buffer of 2.5%. The resulting 7%-8.5% minimum ratio compares with what was effectively a 4% baseline under Basel II, based on a much weaker capital definition that included various instruments with limited loss-absorbing capacity.3 In addition, the computation of RWAs was broadened, based on revised frameworks for securitisations and trading book positions (Table III.1).
These enhanced RWRs were complemented with four new requirements covering risks inadequately addressed in the pre-crisis standards. The resulting "multiple metrics" setup is intended to increase the framework's robustness by guarding more explicitly against the inherent uncertainties of risk management and measurement.4 First, a simple minimum leverage ratio seeks to contain build-ups of excessive leverage in the banking sector, providing a backstop to the RWRs and a degree of protection against model risk, under both the SAs and internal models. Second, a countercyclical capital buffer and G-SIB capital surcharges address macroprudential considerations (Chapter IV). Finally, two liquidity standards (ie the Liquidity Coverage Ratio (LCR) and the Net Stable Funding Ratio) incentivise greater reliance on more stable funding sources (Graph III.1, centre panel) and limit maturity transformation risks.5
Stage 2 reforms: completing the framework
The recently finalised stage 2 of the Basel III reforms completes the framework by focusing mainly on enhancing the consistency and comparability of banks' RWAs (Table III.1). In the past, differences in the design and choice of parameters across banks' internal models had resulted in large differences in risk weights and corresponding capital requirements ("RWA variability"), providing ample leeway for banks to raise their leverage (Graph III.1, left-hand panel). From a prudential perspective, RWA variability is welcome if it reflects legitimate differences in underlying risks or their measurement.6 However, there is evidence that it has also reflected unwarranted factors, such as "gaming" (ie choosing model assumptions to reduce measured risks).7
Such unwarranted RWA variability can be material. Assuming a benchmark capital ratio of 10%, a study by the Basel Committee on Banking Supervision (BCBS) found that two banks with identical banking book assets might report capital ratios differing by up to 4 percentage points (Graph III.2, left-hand panel).8 Moreover, in many cases, internally modelled risk weights were substantially lower than those under the SAs - for corporate exposures, by up to more than 60% (Graph III.2, centre panel). The observed wedge and capital relief are difficult to justify.
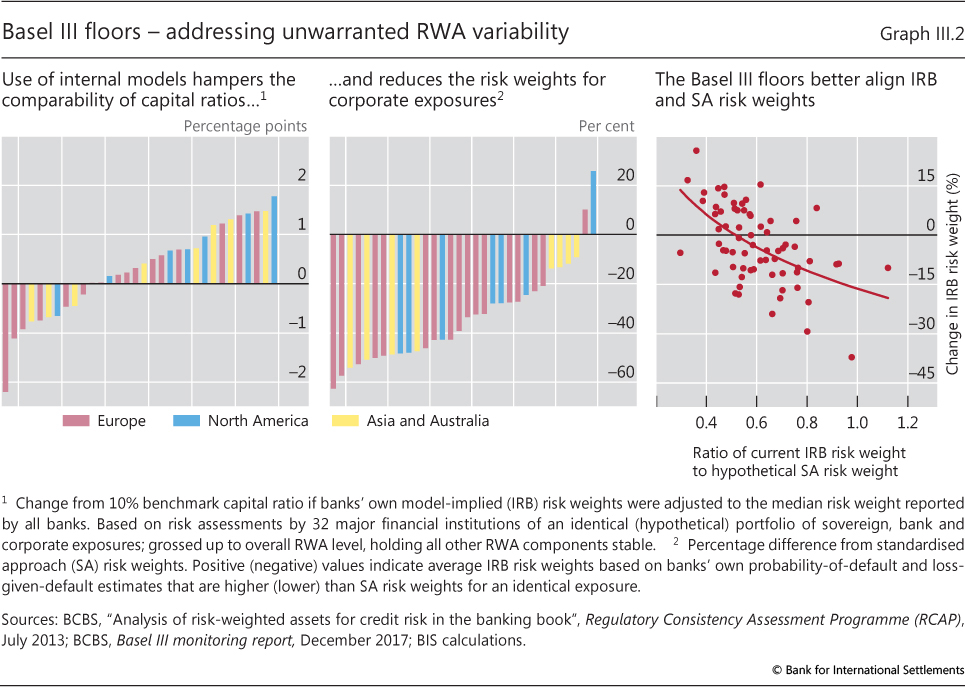
Stage 2 sought to address this unwarranted RWA variability through a range of measures, complementing the leverage ratio introduced with the stage 1 reforms.9 Key among them are constraints on banks' internal modelling practices, known as "input and output floors". These constraints are especially important where model risk is high, eg when data are scarce or modelling techniques untested or not robust (ie for operational risk and various low-default credit portfolios).10
Input floors introduce a measure of conservatism in model parameter choice. They do so by either disallowing the use of internal models for particular exposures or setting minima for model parameters (such as the probability of default (PD)). Input floors address specific sources of RWA variability in a targeted manner. Yet, by design, they have to be set at low levels to avoid penalising some activities (ie by imposing minimum PDs that may be too high for certain low-risk exposures). As such, they do not constrain "aggressively" estimated RWAs for riskier exposures.
The output floor provides an additional degree of protection, by ensuring that a bank's RWA cannot fall below 72.5% of the RWA amount that would result from applying the SA to the same portfolio. In contrast to input floors, the output floor can thus provide a degree of protection against unwarranted RWA variability across the entire risk spectrum. And, unlike the leverage ratio, it limits the capital relief banks can obtain by opting for internal models rather than the SAs.
Recent BCBS data illustrate the effect of the new constraints on RWA variability. Average risk weights tend to change most for the banks that reported risk weights furthest below those implied by the SA (Graph III.2, right-hand panel). Thus, assuming that any differences in the two approaches reflect primarily unwarranted RWA variability, the output floor closes at least part of the gap.
Banks' adjustment: the long path to sustainability
Reaping Basel III's financial stability benefits requires timely and consistent implementation of the new standards, backed by sustainable bank profitability. Supervisory metrics suggest that banks have already completed most of the adjustment to the standards ahead of schedule. Some market-based measures, however, cast doubt on the extent to which banks have managed to transition to viable new business models. Several levers are available to manage this transition. The public sector can provide additional support by removing legal or structural impediments to banks' own adjustment efforts.
Implementation and bank business models
The Basel III standards are being phased in over extended timelines to help banks adjust (Table III.1 above). By now, legal implementation is generally well advanced, with core stage 1 components, such as the new RWRs and the LCR, operational across all BCBS member - and many other - jurisdictions (Graph III.3, left-hand panel). National implementation of other elements, such as the leverage ratio, is progressing, and the stage 2 additions are due to follow mostly by 1 January 2022. Yet experience suggests that agreed implementation schedules may be difficult to maintain and that progress may slow. Therefore, progress monitoring is important - for example, via the BCBS's Regulatory Consistency Assessment Programme (RCAP).
Regardless of national implementation, most banks have already adjusted their balance sheets ahead of time to meet the new standards (Graph III.3, centre panel). One reason is market expectations. The fully loaded (ie completely phased-in) requirements have become the investor benchmark; and banks with regulatory shortfalls risk facing market valuation pressures. Another, related reason is increased supervisory use of stress testing and corresponding disclosures, which often include fully loaded regulatory metrics.11 Thus, looking ahead, one should expect banks to front-load their adjustments also to the latest stage 2 revisions. The amounts involved are small. Resulting CET1 capital shortfalls among the larger, BCBS-monitored internationally active banks are estimated at €27.9 billion (based on end-2015 balance sheet information), less than 1% of these banks' combined CET1 capital. And the estimate probably overstates the true shortfall, as it does not account for banks' business model or portfolio adjustments in response to the regulations.
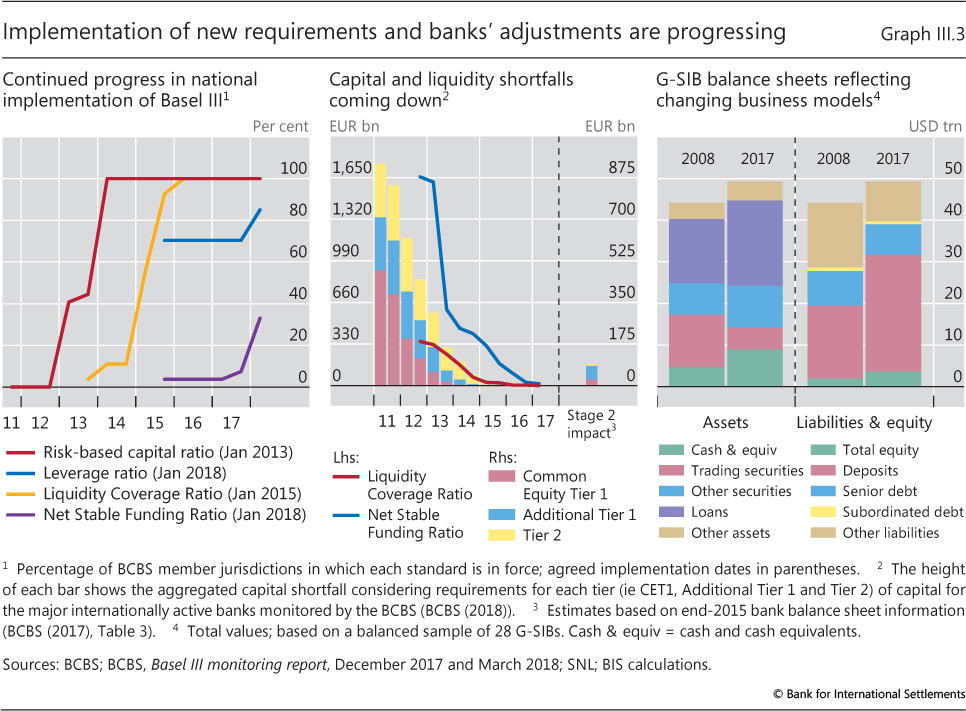
Indeed, the impact of the reforms is already evident. Trends in aggregate G-SIB balance sheets, for example, tally quite closely with the reform's objectives (Graph III.3, right-hand panel): more and higher-quality capital; less reliance on short-term wholesale funding; bigger high-quality liquid asset (HQLA) buffers; and a shift away from business lines such as proprietary trading, apparent from the shedding of trading assets. This reflects a broader shift towards more retail-oriented business models, with relatively stable funding and income sources.12
Bank resilience: moving ahead
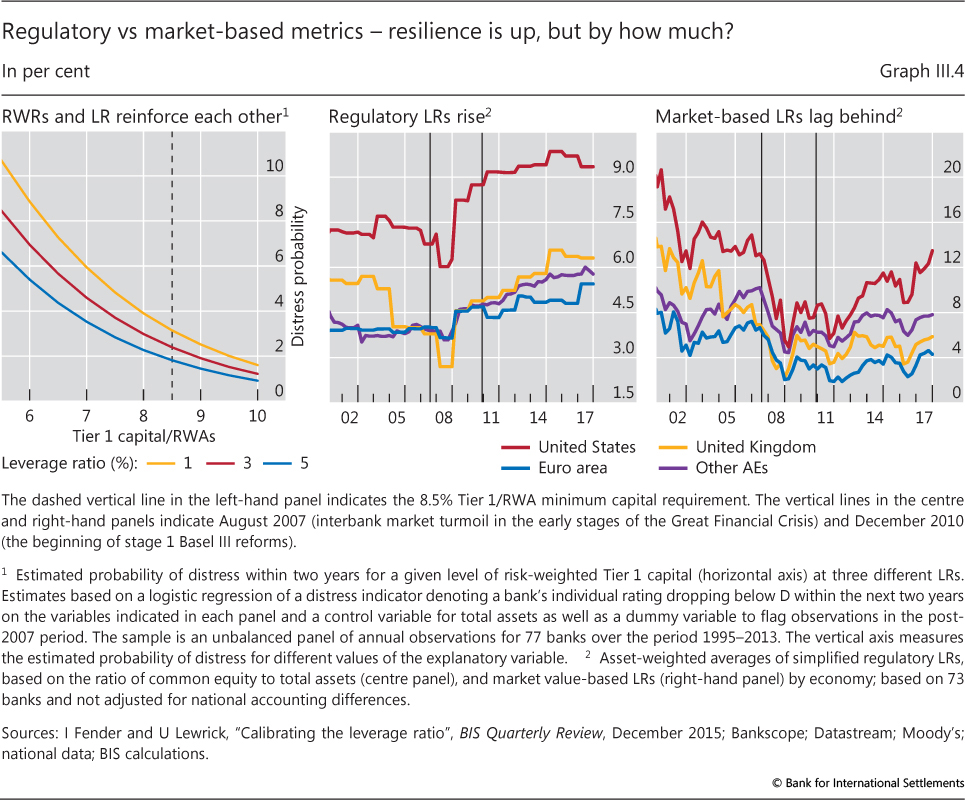
With bank balance sheet adjustment to the new regulatory standards mostly completed, a key question concerns the degree to which tighter regulation translates into increased bank resilience - Basel III's ultimate objective.
One way to measure progress is to assess the impact of changes in different capitalisation metrics on indicators of bank distress.13 For example, simple logistic regressions - run on data covering 77 banks - provide estimates of the combined marginal predictive power of two key Basel III metrics (Tier 1 capital/RWAs and the leverage ratio) for a credit rating downgrade to "distress level" (Graph III.4, left-hand panel). Subject to the usual caveats, this analysis suggests that the likelihood of a bank facing distress within a two-year period decreases as the Tier 1 capital ratio increases (ie shifts along the horizontal axis). And importantly, for a given Tier 1 capital ratio, higher leverage ratio requirements tend to further reduce the distress probability (eg shifts from the yellow to the red line). This highlights the complementarity of the two ratios and supports the framework's multiple metrics setup (see above).
In the aggregate, higher capital and resilience have been achieved with little sign of an adverse impact on bank lending.14 Bank lending to the private non-financial sector as a share of GDP has remained stable in many jurisdictions - meeting or exceeding pre-crisis averages.15 That said, there are at least two areas where more action is needed to further increase resilience.
The first area concerns the link between resilience and regulatory reporting requirements, which can raise the risk of regulatory arbitrage. One such example relates to banks' "window-dressing" around regulatory reporting dates. The incentive arises in part because of differences in how authorities implement the leverage ratio across jurisdictions. Some, such as in the United States, require the ratio to be fulfilled on the basis of period averages, while others, such as in the euro area, do so on the basis of quarter-end values.
There is evidence that banks without averaging requirements markedly contract their balance sheets at quarter-ends relative to those subject to averaging (Box III.A). This can influence market functioning and monetary policy implementation, for instance by hindering access for those market participants that need to transact at quarter-ends. And it reduces the prudential usefulness of the leverage ratio, which may end up being met only four times a year.
Box III.A
Banks' window-dressing: the case of repo markets
Window-dressing refers to the practice of adjusting balance sheets around regular reporting dates, such as year- or quarter-ends. Window-dressing can reflect attempts to optimise a firm's profit and loss for taxation purposes. For banks, however, it may also reflect responses to regulatory requirements, especially if combined with end-period reporting. One example is the Basel III leverage ratio. This ratio is reported based on quarter-end figures in some jurisdictions, but is calculated based on daily averages during the quarter in others. The former case can provide strong incentives to compress exposures around regulatory reporting dates - particularly at year-ends, when incentives are reinforced by other factors (eg taxation).
Banks can most easily unwind positions around key reporting dates if markets are both short-term and liquid. Repo markets generally meet these criteria. As a form of collateralised borrowing, repos allow banks to obtain short-term funding against some of their assets - a balance sheet-expanding operation. The cash received can then be onlent via reverse repos, and the corresponding collateral may be used for further borrowing. At quarter-ends, banks can reverse the increase in their balance sheet by closing part of their reverse repo contracts and using the cash thus obtained to repay repos. This compression raises their reported leverage ratio.
The data indicate that window-dressing in repo markets is material. Data from US money market mutual funds (MMMFs) point to pronounced cyclical patterns in banks' US dollar repo borrowing, especially for jurisdictions with leverage ratio reporting based on quarter-end figures (Graph III.A, left-hand panel). Since early 2015, with the beginning of Basel III leverage ratio disclosure, the amplitude of swings in euro area banks' repo volumes has been rising - with total contractions by major banks up from about $35 billion to more than $145 billion at year-ends. While similar patterns are apparent for Swiss banks (which rely on quarter-end figures), they are less pronounced for UK and US banks (which use averages). Banks' temporary withdrawal from repo markets is also apparent from MMMFs' increased quarter-end presence in the Federal Reserve's reverse repo (RRP) operations, which allows them to place excess cash (right-hand panel, black line). Despite the implicit floor provided by the rates on the RRP (yellow line), there are signs of volatility spikes in key repo rates around quarter-ends (blue line). Such spikes may complicate monetary policy implementation and affect repo market functioning in ways that can generate spillovers to other major funding markets, especially if stress events coincide with regulatory reporting dates.
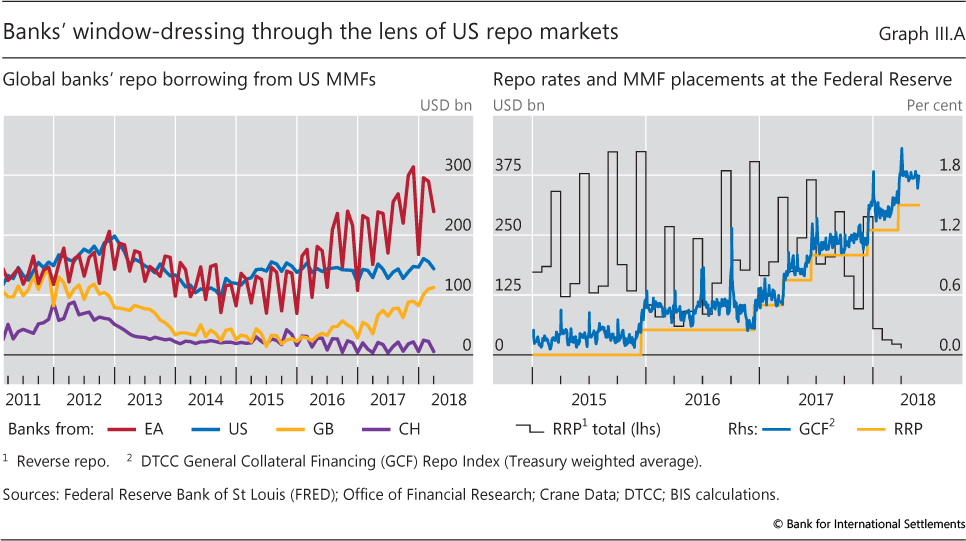
The end-2017 contraction is equivalent to about 1.4% of the sample banks' total leverage ratio exposure measure. See CGFS, "Repo market functioning", CGFS Papers, no 59, April 2017; and I Aldasoro, T Ehlers and E Eren, "Business models and dollar funding of global banks", BIS Working Papers, no 708, March 2018.
Prudential authorities can help reduce or prevent these types of effect in various ways. Options include aligning national implementation on the basis of period averages, stepping up supervisory responses, and requiring banks to disclose both metrics to enhance market discipline.
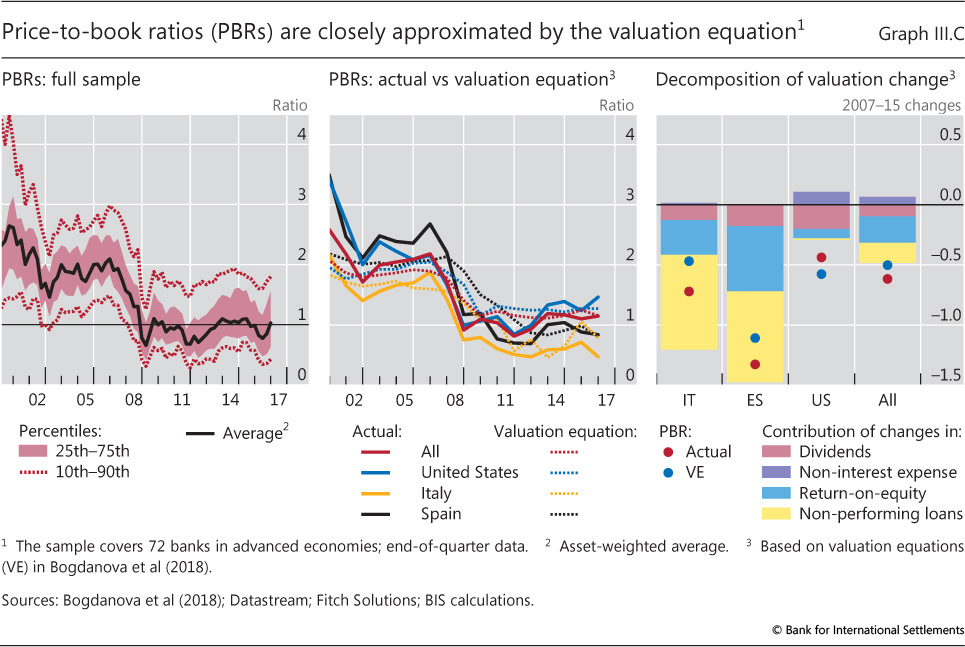
The second area concerns the outlook for bank profitability. Bank profitability is critical for resilience, as it affects the speed with which banks can recover from losses. Despite the progress made in terms of balance sheet and business model adjustments, market valuations for many banks point to continued investor scepticism about profitability prospects. Average bank price-to-book ratios (PBRs) hovered around a level of two times book value right before the GFC - admittedly, a level inconsistent with the risks revealed by the GFC (see regulatory discussion above). They then plummeted to values below one in 2008-09, and recovered only recently, while generally remaining lower than pre-crisis, especially for European banks.
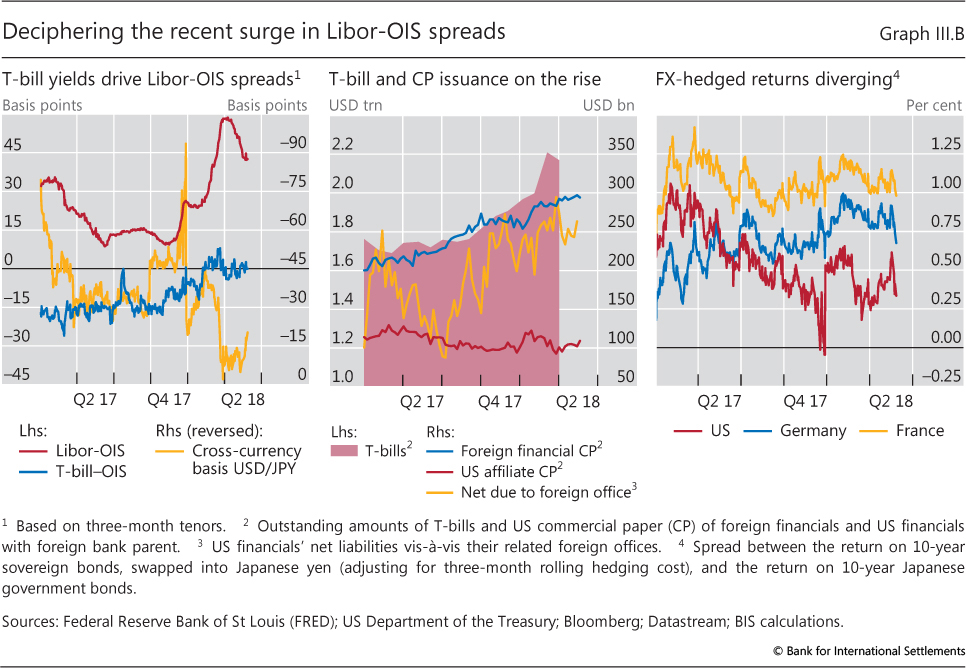
Thus, once adjusted for depressed PBRs, conventional resilience measures look less solid.16 One example is market-based leverage ratios, which have improved by less than their book value counterparts (compare the right-hand and centre panels, Graph III.4). Bank credit default swap (CDS) spreads and stand-alone credit ratings (which seek to abstract from official support, known to have been cut) tell a similar story (Graph III.5, left-hand and centre panels).17 Even though pre-crisis levels are unlikely to be an appropriate benchmark, this suggests that reduced bank profitability has at least partly offset the stabilising effect of reduced leverage and maturity transformation. At the same time, there are signs that banks may have become less susceptible to adverse funding shocks. One example is the surge in Libor-OIS spreads in early 2018, which drove up bank funding costs, but left bank CDS spreads broadly unaffected (Box III.B and Graph III.5, left-hand panel).
Box III.B
The widening of Libor-OIS spreads
Spreads between short-term US dollar Libor and overnight indexed swap rates (Libor-OIS), a common indicator of funding stress, widened substantially in early 2018 (Graph III.B, left-hand panel). Yet, unlike during previous episodes, the surge did not reflect rising bank riskiness, as gauged from credit default swap spreads. Nor did it coincide with signs of stress in US dollar funding markets, as indicated by cross-currency basis spreads. What might explain it?
Two likely drivers are increased issuance of short-term US Treasury securities (T-bills) and repatriation flows due to the 2017 US tax reform. T-bill issuance jumped by more than $300 billion in Q1 2018 (centre panel). As a result, short-term yields increased, with the associated rise in the T-bill-OIS spread accounting for up to 40% of the change in Libor-OIS (left-hand panel). Tax reform is likely to explain part of the remainder, with US corporates repatriating some of the foreign profits previously held abroad. As part of these was invested in non-US bank commercial paper (CP), such flows tend to lower the supply of offshore US dollar funding for banks. This comes on top of reduced supply from money market mutual funds (MMMFs), which has not returned to pre-October 2016 US MMMF reform levels. Bank funding costs thus rose amid strong CP issuance in early 2018 (centre panel), adding to the rise in Libor-OIS.
The tightening of the cross-currency swap basis (left-hand panel) contrasts with previous episodes of Libor-OIS widening. One explanation put forward is that the US base erosion and anti-abuse tax raised foreign bank US affiliates' funding costs. Those affiliates would have to issue more debt of their own while cutting back on inter-office funding. This would lower demand for FX hedging, contributing to a tighter basis. Yet, contrary to this explanation, US affiliates' issuance declined, whereas net inter-office positions rose as Libor-OIS widened (centre panel). An alternative explanation of tight cross-currency spreads relates to portfolio rebalancing decisions. FX-hedged returns on long-term US bonds declined relative to those on euro area sovereign debt, amid expectations of rising US interest rates (right-hand panel). Non-US investors may thus have reduced their dollar securities holdings and, as a result, their demand for FX hedging. Indeed, according to official data, Japanese investors cut their US bond holdings by about $50 billion while investing $30 billion in German and French sovereign bonds in early 2018.
See BIS, 87th Annual Report, June 2017, Chapter II.
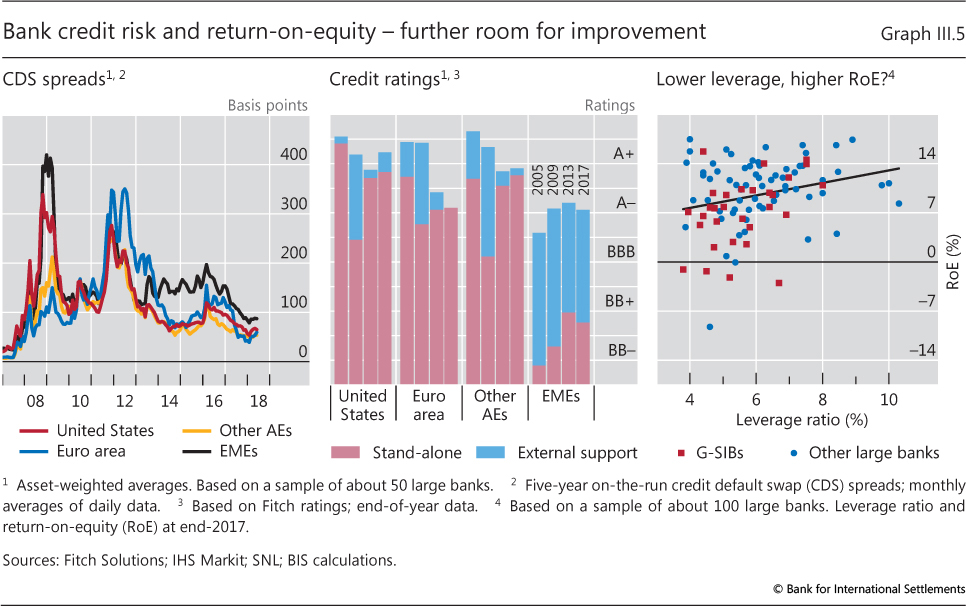
Banks could seek to raise profitability and valuations in time-tested ways, such as cutting costs and repairing balance sheets by eliminating non-performing loans. Bank valuations are not generally out of line with what is predicted by simple valuation models that assign importance to those variables (Box III.C). In addition, there is evidence that a stronger capital base can help too. Even though lower leverage mechanically reduces banks' return-on-equity (RoE), better-capitalised institutions tend to exhibit a similar or even higher RoE than their more leveraged peers (Graph III.5, right-hand panel).18
Looking ahead, a key challenge is that these adjustments have to take place at a time of rapid technological change in the financial sector (various types of "fintech" innovation). On the one hand, many of these innovations allow banks to better exploit scale economies and - ultimately - reduce costs. One example is the use of distributed ledger technology to improve back office functions (Chapter V). On the other hand, client expectations are changing - and with them the nature of bank competitors. Clients, in particular those on the retail side, increasingly ask for a "seamless customer experience". While this may help segment the customer base and support price discrimination, the corresponding shift to multipurpose internet platforms invites new competitors. Here, so-called "big tech" players - dominant technology firms from the online sales or messaging sector - loom large. These already have the necessary IT infrastructure, analytical skills, financial resources and established client base to erode banks' market share.19
Further public sector initiatives could act as a catalyst for banks to make the necessary adjustments. These include efforts to tighten banks' provisioning policies (eg via asset quality reviews) and to tackle impediments to the reduction of overcapacity and banking sector consolidation.20 The arrival of big tech competitors, in turn, may require cooperation among regulators from different fields (data protection agencies, competition authorities and others) and jurisdictions to preserve a level playing field ("same risk, same regulation"), without unduly constraining technological innovation.21 One such example is aligning constraints on the accumulation, use and sharing of client data for both banks and non-banks. The favourable macroeconomic environment (Chapter I), rising term spreads and reduced legacy problems (eg crisis-related litigation costs) provide further support. Banks that fail to seize this opportunity may see their resilience tested before their adjustment to the post-crisis environment is fully complete (see also the discussion on snapback risk below).
Box III.C
Factors driving bank equity valuations
Low price-to-book ratios (PBRs), defined as the market value of a bank's equity to its accounting - or book - value, have been a persistent sign of post-crisis challenges in the banking sector. Having hovered at around two times book value, on average, in the run-up to the Great Financial Crisis (GFC), they plummeted to values below unity by 2009 and recovered only recently - while remaining below pre-crisis levels (Graph III.C, left-hand panel). As a measure of the market premium (or discount) applied to a bank's book value, PBRs are a key indicator of banks' expected underlying profitability. Hence, there is a strong interest in understanding what drives these market premia.
Recent BIS research sheds some light on this question by estimating a valuation equation (VE) for a sample of 72 banks from 14 jurisdictions using annual data over the 2000-16 period. The panel regression includes five (sets of) explanatory variables known to affect PBRs, both directly and indirectly: (i) loans (including non-performing loans (NPLs)), (ii) deposits, (iii) expenses, (iv) other bank-specific factors (for instance, leverage or dividend payments) and (v) return-on-equity (RoE; a proxy of investors' return expectations).
The estimated VE tracks the evolution of bank PBRs closely across both time and countries (centre panel). PBRs are generally in line with VE-implied valuations, suggesting that investors' valuation benchmarks do not seem to have changed materially post-crisis. Despite the relatively large number of explanatory variables, just four key drivers explain around three quarters of the VE-implied change in bank PBRs between 2007 and 2015, with NPLs and RoE the most important ones (right-hand panel).
These findings suggest that banks are well placed to enhance their market value by focusing on a few key profitability drivers under direct management control, such as proactively addressing NPLs and other legacy assets, tight control of non-interest expenses, and reducing overcapacity in the sector.
For details, see B Bogdanova, I Fender and E Takáts, "The ABCs of bank PBRs", BIS Quarterly Review, March 2018. This analysis takes that of C Calomiris and D Nissim, "Crisis-related shifts in the market valuation of banking activities", Journal of Financial Intermediation, vol 23, no 3, 2014, pp 400-35, and extends it to an international setting.
Bank/non-bank interactions: new pressure points?
The adjustment of banks' business models under way raises a number of questions at the current juncture. One such question concerns the system-level impact of the rising share of non-bank intermediaries in financial markets. Their interaction with banks and other parts of the financial system is changing the dynamics of markets in response to shocks. A key example relates to the process of monetary policy normalisation in major advanced economies and how increases in longer-term interest rates, including the possibility of rapid snapback (Chapter I), could propagate through the financial system.
Institutional asset managers: bigger footprint, changing dynamics
Non-bank institutional asset managers, ranging from investment management companies to pension funds and insurers, have grown strongly over the past decade. Their total assets are estimated at nearly $160 trillion, exceeding those of banks worldwide.22 Several drivers have contributed to this growth. They include an increasing demand for long-term investments, such as on the part of pension funds, and search for yield in an environment of unusually low interest rates, which has boosted the growth of open-end mutual funds and exchange-traded funds (ETFs).
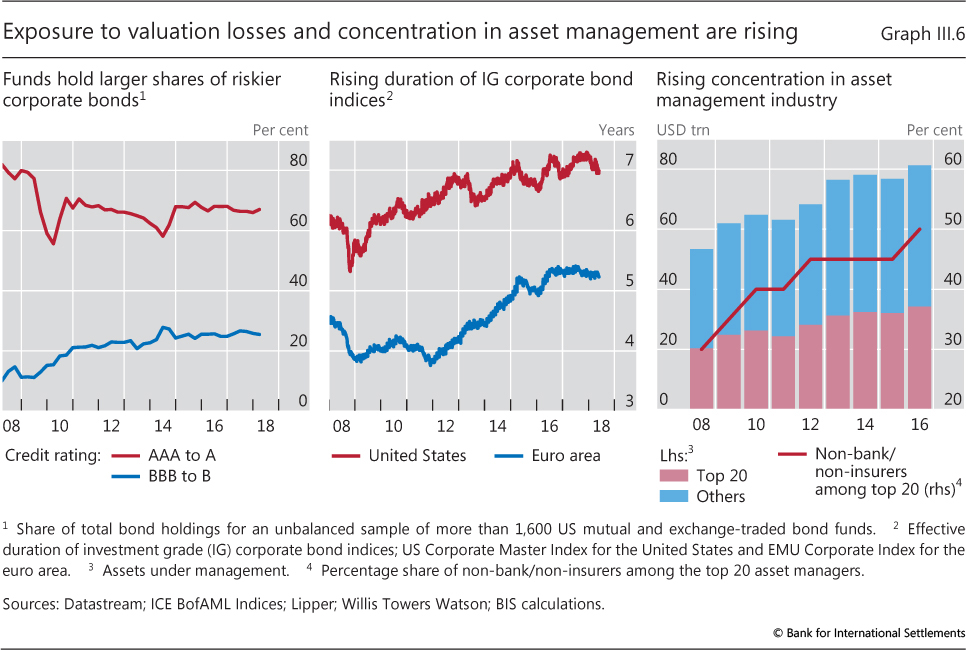
Past years of exceptionally low interest rates have raised a variety of challenges for those institutional asset managers that are major fixed income investors.23 These firms benefited initially from the decline in interest rates, which generated valuation gains on their bond holdings. Yet persistently low rates and compressed term premia reduced the yields on new investments, driving down future returns. Pension funds and insurance companies faced additional pressures owing to the rising mark-to-market value of their long-term liabilities. This provided strong incentives for institutional asset managers to extend the duration of their portfolio or to invest in riskier assets - a trend borne out in the available data (Graph III.6, left-hand and centre panels). Taken together, these factors suggest that sensitivity to snapback in both interest rates and volatilities has increased.
Various structural features of the asset management industry may contribute to magnifying this vulnerability. One is a high concentration of assets under management, which can result in a clustering of risks within a limited number of large asset management companies (Graph III.6, right-hand panel). True, investment activity is typically spread out over a large number of separately managed funds within these firms, mitigating the risk of concerted trading activity. But there is evidence that fund families exhibit correlated return and investor flow patterns.24 In addition, reliance on common service providers (eg for IT infrastructures, risk management and pricing tools, or custody services) suggests common exposures to operational risks. And, rising investor demand for lower-cost passive asset management products may have increased the risk of crowded trades in leading market indices.25
Snapback and interlinkages
Institutional asset managers and banks are interlinked in a variety of ways, opening up both direct and indirect channels for the propagation of snapback risks and similar shocks. Open-end funds are especially relevant in this context. Not only are they exposed to valuation losses, like any other rate-sensitive investor, but they also face investor redemption risk (Box III.D). Funds' credit lines and deposits at banks thus represent a key direct link. In a snapback scenario, with widespread investor redemptions triggering a run-down of funds' cash balances, depository banks could be exposed to large deposit withdrawals by fund managers and rising credit exposures to funds. Granted, direct bank exposures to such risks are perhaps less of a challenge than indirect ones, given the supervisory attention that interest rate risks have received in recent years.26 Even so, there is a need for banks to monitor and manage these risks particularly carefully.
Additional pressure points could magnify these effects. For one, large-scale redemptions could force open-end funds to sell relatively illiquid assets at short notice and, hence, at large discounts, further depressing valuations. Indeed, funds that promise daily redemptions - ie those offering deposit-like instruments - have increased their footprint. In the United States, for example, they now hold more than 16% of corporate debt according to financial accounts data - up from less than 7% in 2005. This is bound to have changed market dynamics.
Funds' liquidity management thus plays an important role in assessing the broader market impact of investor redemptions. Funds that invest in relatively illiquid assets, such as corporate bonds or some emerging market economy (EME) debt, need to strike a difficult balance between selling illiquid assets at potentially large discounts and running down their cash buffers, which may leave them vulnerable to future outflows. In addition, investors may be tempted to redeem their shares to front-run others, anticipating the liquidation cost-induced dilution of fund portfolios.
Box III.D
When yields "snap back" - funds' exposures and amplification effects
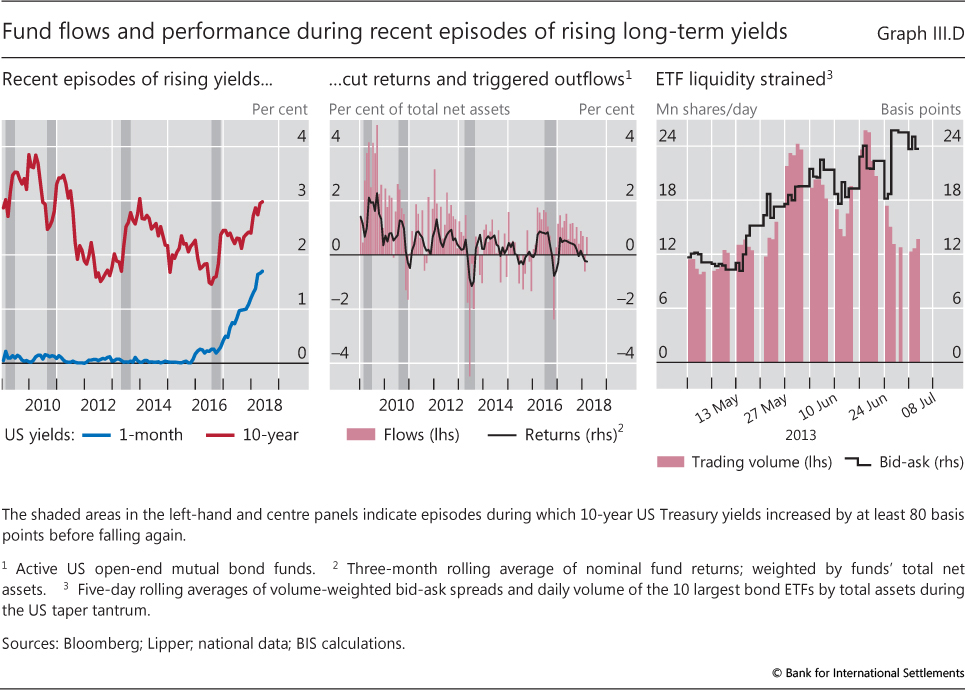
Interest rate risk is inherent in the regular activities of bond market investors and therefore actively managed. Even so, past episodes of snapbacks in long-term rates are useful reminders of the potential vulnerabilities of some segments of the fund industry. Historically, interest rate shocks have been linked to monetary policy decisions. As such, they coincided with rising short-term rates and flattening yield curves. More recently, however, long-term rates have occasionally snapped back without notable changes in short-term rates (Graph III.D, left-hand panel). Drivers of market dynamics may thus have changed, possibly giving rise to more abrupt market adjustments than in the past.
Open-end bond funds and exchange-traded funds (ETFs), key buyers of corporate bonds and other fixed income instruments in recent years, are particularly exposed to episodes of rapidly rising rates. This reflects both the induced valuation losses and the redemption pressures caused by declining fund returns (centre panel). Such redemptions may force sales at large discounts, exacerbating the downward pressure on fund returns and triggering further redemptions. Likewise, ETF investors may find it difficult to sell their shares in secondary markets, with bid-ask spreads often widening as fund returns deteriorate (right-hand panel).
Several factors may amplify such dynamics. For one, credit spreads are already quite compressed. Bond investors are thus unlikely to benefit from any offsetting effect of tighter spreads during snapbacks. In addition, portfolio duration has increased for many funds, amplifying the valuation impact of rate changes. Persistently low market volatility, notwithstanding recent increases, may have further sustained fixed income positions at low yields, increasing the scope for abrupt sell-offs. Finally, funds may amplify market adjustments by shedding assets in excess of redemptions to increase cash buffers - especially if other liquidity management tools (eg swing pricing) fail to discourage investors from redeeming.
See S Morris, I Shim and H S Shin, "Redemption risk and cash hoarding by asset managers", Journal of Monetary Economics, 89, 2017, pp 88-91; and U Lewrick and J Schanz, "Is the price right? Swing pricing and investor redemptions", BIS Working Papers, no 664, October 2017.
Other institutional investors, for instance insurance companies and pension funds, could further intensify such market reactions. One issue is increasingly similar portfolio holdings in an environment of low rates (see above), making concerted selling more likely. Another is the use of dynamic hedging strategies, which implies that these investors would respond to any rise in long-term yields by selling long-term bonds in order to contain duration mismatches, adding to the risk of abrupt interest rate adjustments.27
Indirect, market-based interlinkages represent an additional channel of shock propagation. Any initial, snapback-induced position adjustment by mutual funds or other rate-sensitive investors is likely to be exacerbated by deteriorating market liquidity conditions, which would tend to spill over into other markets (eg via collateral valuations).
A key point is that structural changes in the provision of immediacy services may not be visible in standard measures of market liquidity, masking the risks associated with holding assets that may turn out to be illiquid in some scenarios. For example, many banks and other market-makers have cut back the amount of risk capital they allocate to trading activities.28 To some extent, the reduction in market-making has been compensated by increased agency-based trading, in which the intermediary matches offsetting client orders with limited commitment of own balance sheet capacity. One implication of this trend is that the execution of large orders, particularly during stressed market conditions, has become more difficult (Graph III.7, left-hand panel). The associated risks have shifted from market-makers to investors, especially in the less liquid segments of the fixed income markets, such as EME debt or corporate bonds. On top of that, low yields and increasing competition have discouraged funds from raising low-yielding liquidity buffers, affecting their ability to manage redemption risks (Graph III.7, centre panel).
Alternative liquidity providers, such as proprietary trading firms (PTFs), have increased their market share in some fixed income markets. Their activities, however, have typically been limited to the most liquid segments, for example those for major advanced economy sovereign bonds. In addition, many PTFs trade with limited commitment of risk capital and lack the balance sheet capacity to maintain large inventories - as is generally necessary for market-making in infrequently traded assets, such as corporate bonds. This suggests that, while increasing competition is likely to further reduce the transaction costs of relatively liquid assets, funds invested in relatively illiquid ones remain exposed to high liquidity risks.
Developments in the ETF sector illustrate how these different factors can interact during abrupt interest rate moves and volatility spikes. ETFs are index-tracking investment funds. Yet, in contrast to traditional open-end mutual funds, their shares trade on secondary markets, and their creation and redemption are exclusively settled between designated financial intermediaries ("authorised participants", APs) and the ETF sponsor, usually an asset management company.29 While ETFs are thus not directly exposed to investor redemption risk, other pressure points may arise.
One concerns APs' capacity to support secondary market liquidity in a snapback scenario. Under normal market conditions, APs arbitrage any difference in the ETF share price and that of the securities in the underlying index. But large selling pressure from ETF investors could overwhelm the APs' capacity to fund such arbitrage. Corporate bond ETFs provide one such example. While APs can redeem the shares they acquire from investors with the ETF sponsor in exchange for the underlying bonds, APs may hesitate to build up large bond inventories at a time of high risk and strained market liquidity in the underlying bond markets. This would drive a wedge between ETF prices and those of the underlying securities, which could in turn trigger further position adjustments and cross-market spillovers. Concentration risk could amplify such tensions, since major APs also provide immediacy services in other markets and to other investors (eg for open-end funds).
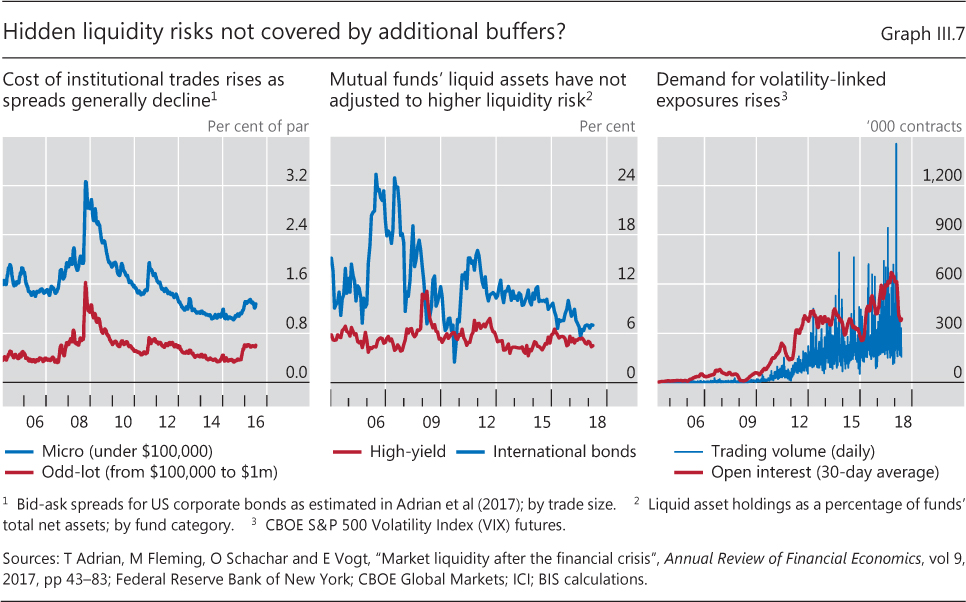
Another issue concerns the procyclical trading activity in new ETF structures. The past few years have seen a growing demand for financial instruments that allow volatility trading - among others, ETFs (Graph III.7, right-hand panel). These products are designed to maintain a target exposure to a given volatility index, ie buying when the index rises and selling when it declines in a rather mechanical way. As a result, bouts of volatility prompt procyclical trading, reinforcing the initial volatility shock. Indeed, recent episodes of volatility spikes in equity markets have uncovered such dynamic feedback effects, highlighting the need for effective market backstops and prudent management of volatility risk.30
Implications for prudential policy
Structural changes in the asset management industry suggest that shock propagation can work through new, market-based channels that may amplify price movements relative to pre-crisis. Thus, even though banks and other intermediaries have become more resilient, snapback and similar shocks could lay bare new vulnerabilities. This has implications for prudential policy, adding to those in other policy areas (Chapters I and II).
For the banking sector, changes in market dynamics generate new exposures that may be insufficiently covered by current risk management practices. This underlines the need for tight supervision. In addition to guidance clarifying supervisory expectations regarding the management of interest rate risk, stress tests represent a key tool. In this context, adverse scenarios may need to be adapted to better reflect snapback-related exposures of banks' clients and counterparties and any associated knock-on effects.
Furthermore, supervisory attention may need to shift more in the direction of non-bank players and how these would perform in snapback and other stress scenarios. One key issue is investment funds' liquidity management, which is their first line of defence in response to redemption pressures. Various tools are available to improve the management of these risks. These include additional liquidity buffers to mitigate fire sale risks as well as efforts to further develop investment funds' liquidity stress testing capacity (Chapter IV).31 More work may be needed, however, to assess the effectiveness of these measures in different redemption scenarios in order to inform regulatory calibration decisions.
Endnotes
1 See BCBS, Governors and Heads of Supervision finalise Basel III reforms, press release, 7 December 2017; and Basel III: finalising post-crisis reforms, December 2017.
2 Under the new total loss-absorbing capacity (TLAC) standard, as of 1 January 2022 all G-SIBs will be required to have eligible TLAC instruments equal to a minimum of at least 18% of their risk-weighted assets (RWAs), not including any applicable regulatory capital buffers. TLAC will also need to be equivalent to at least 6.75% of the Basel III leverage ratio exposure measure. For details, see FSB, Summary of findings from the TLAC impact assessment studies, November 2015.
3 Only half of the 8% Basel II minimum requirement was defined in terms of Tier 1 capital instruments, which included a range of hybrid structures and intangibles. See S Cecchetti, "The jury is in", CEPR Policy Insights, no 76, December 2014.
4 For a motivation of this multiple metrics setup in a general equilibrium context, see F Boissay and F Collard, "Macroeconomics of bank capital and liquidity regulations", BIS Working Papers, no 596, December 2016.
5 In addition, through revised guidance principles, the framework stresses the importance of prudent corporate governance (eg by promoting effective control functions).
6 For details, see BIS, 83rd Annual Report, June 2013, Box V.B.
7 See M Behn, R Haselmann and V Vig, "The limits of model-based regulation", ECB Working Papers, no 1928, July 2016, for estimates of the extent of such gaming. Similar evidence based on more recent data is provided in F Niepmann and V Stebunovs, "Modeling your stress away", mimeo, 2018.
8 See BCBS, "Analysis of risk-weighted assets for credit risk in the banking book", Regulatory Consistency Assessment Programme (RCAP), July 2013, for details.
9 See BCBS, Basel III leverage ratio framework and disclosure requirements, January 2014; and M Brei and L Gambacorta, "Are bank capital ratios pro-cyclical? New evidence and perspectives", Economic Policy, vol 31, no 86, 2016, pp 357-403.
10 The scarcity (or outright lack) of reliable data can prevent supervisors from validating model outputs with sufficient confidence. This suggests that the use of internally modelled approaches may have to be withdrawn or restricted. Under Basel III, operational risk and various low-default credit portfolios now fall into this category. Exposures to large and mid-sized corporates, for example, are migrated away from the advanced IRB (which allows for modelling of loss-given-default (LGD)) to the foundation IRB or SA (which do not).
11 See eg European Banking Authority, 2016 EU-wide stress test: results, July 2016.
12 See BIS, 87th Annual Report, June 2017, Chapter V. For more analysis, see R Roengpitya, N Tarashev, K Tsatsaronis and A Villegas, "Bank business models: popularity and performance", BIS Working Papers, no 682, December 2017; and CGFS, "Structural changes in banking after the crisis", CGFS Papers, no 60, January 2018.
13 See I Fender and U Lewrick, "Calibrating the leverage ratio", BIS Quarterly Review, December 2015, pp 43-58.
14 Discussions of the macroeconomic impact of higher bank capital often presume that higher bank capital increases funding costs, which then translates into higher lending spreads and less lending. Recent research suggests that the opposite may be true, in that higher bank capital goes hand in hand with higher lending. See eg L Gambacorta and H S Shin, "Why bank capital matters for monetary policy", Journal of Financial Intermediation, 2018 (forthcoming).
15 In Q3 2017, bank lending-to-GDP ratios in the euro area and the United Kingdom (at around 90% in each case) as well as the United States (about 45%) remained broadly unchanged from the average levels in 2002-06. Major EMEs, such as Brazil, China and India, even saw rising ratios relative to pre-crisis levels. See BIS, 86th Annual Report, June 2016, Chapter VI.
16 For a discussion, see N Sarin and L Summers (2016), "Understanding bank risk through market measures", Brookings Papers on Economic Activity, Fall, 2016, pp 57-127.
17 See C Borio, "The banking industry: struggling to move on", keynote speech, Fifth EBA Research Workshop, 28-29 November 2016.
18 Econometric analysis suggests that, post-GFC, higher capitalisation levels relative to total assets coincide with higher bank valuations. Accordingly, investors appear to have shifted from viewing leverage as a mechanism primarily for increasing RoE to a greater focus on ways in which excessive leverage can threaten solvency. See B Bogdanova, I Fender and E Takáts (2018), "The ABCs of bank PBRs", BIS Quarterly Review, March 2018, pp 81-95; and C Calomiris and D Nissim, "Crisis-related shifts in the market valuation of banking activities", Journal of Financial Intermediation, vol 23, no 3, 2014, pp 400-35.
19 In a recent survey by Bain & Company, more than half of all US respondents - and 74% of those aged 18-24 - indicated that they expect to buy a financial product from a technology firm in the next five years. See Bain & Company, "Banking's Amazon moment", Bain Brief, March 2018.
20 See C Borio, B Vale and G von Peter, "Resolving the financial crisis: are we heeding the lessons from the Nordics?", BIS Working Papers, no 311, June 2010; and European Systemic Risk Board, "Is Europe overbanked?", Reports of the Advisory Scientific Committee, no 4, June 2014.
21 See A Carstens, "A level playing field in banking", keynote address, Institute of International Finance Board of Directors dinner, 21 January 2018.
22 See FSB, Global shadow banking monitoring report 2017, March 2018.
23 For a discussion, see BIS, 86th Annual Report, June 2016, Chapter VI.
24 See eg E Elton, M Gruber and C Green, "The impact of mutual fund family membership on investor risk", Journal of Financial and Quantitative Analysis, vol 42, no 2, 2007, pp 257-78.
25 For a discussion of risks related to passive asset management, see V Sushko and G Turner, "The implications of passive investing for securities markets", BIS Quarterly Review, March 2018, pp 113-31.
26 For example, since early 2010, US bank and depository supervisors have had explicit inter-agency guidance in place to alert market participants to the importance of interest rate risk and remind them of supervisory expectations regarding sound risk management practices. Similar guidance has been issued in other jurisdictions.
27 See D Domanski, H S Shin and V Sushko, "The hunt for duration: not waving but drowning?", IMF Economic Review, vol 65, no 1, 2017, pp 113-53, for a discussion of potential amplification effects arising from insurance companies.
28 For a discussion, see CGFS, "Market-making and proprietary trading: industry trends, drivers and policy implications", CGFS Papers, no 52, November 2014; and "Fixed income market liquidity", CGFS Papers, no 55, January 2016.
29 For a discussion of ETFs and the associated risks, see V Sushko and G Turner, "What risks do exchange-traded funds pose?", Bank of France, Financial Stability Review, April 2018, pp 133-44.
30 See eg BIS, "Volatility is back", BIS Quarterly Review, March 2018, pp 1-15.
31 FSB, Policy recommendations to address structural vulnerabilities from asset management activities, January 2017.