Statistical release: BIS international banking statistics and global liquidity indicators at end-March 2024

Key takeaways
- Banks' global cross-border claims increased by $1.1 trillion during Q1 2024, driven by bank credit (ie loans and holdings of debt securities). Outstanding claims reached $39.6 trillion, up 5% year-on-year (yoy).
- Bank credit to advanced economies (AEs) increased the most (+6% yoy), driven by credit to non-banks. Credit to emerging market and developing economies (EMDEs) grew by 2%, supported by strong lending in Chinese renminbi.
- The BIS global liquidity indicators (GLIs) show that the growth in dollar-denominated foreign currency credit to non-banks in EMDEs turned positive (1%) for the first time in nearly two years. The role of bond financing in dollar and euro credit continued to increase.
Credit to both AEs and EMDEs continues to grow
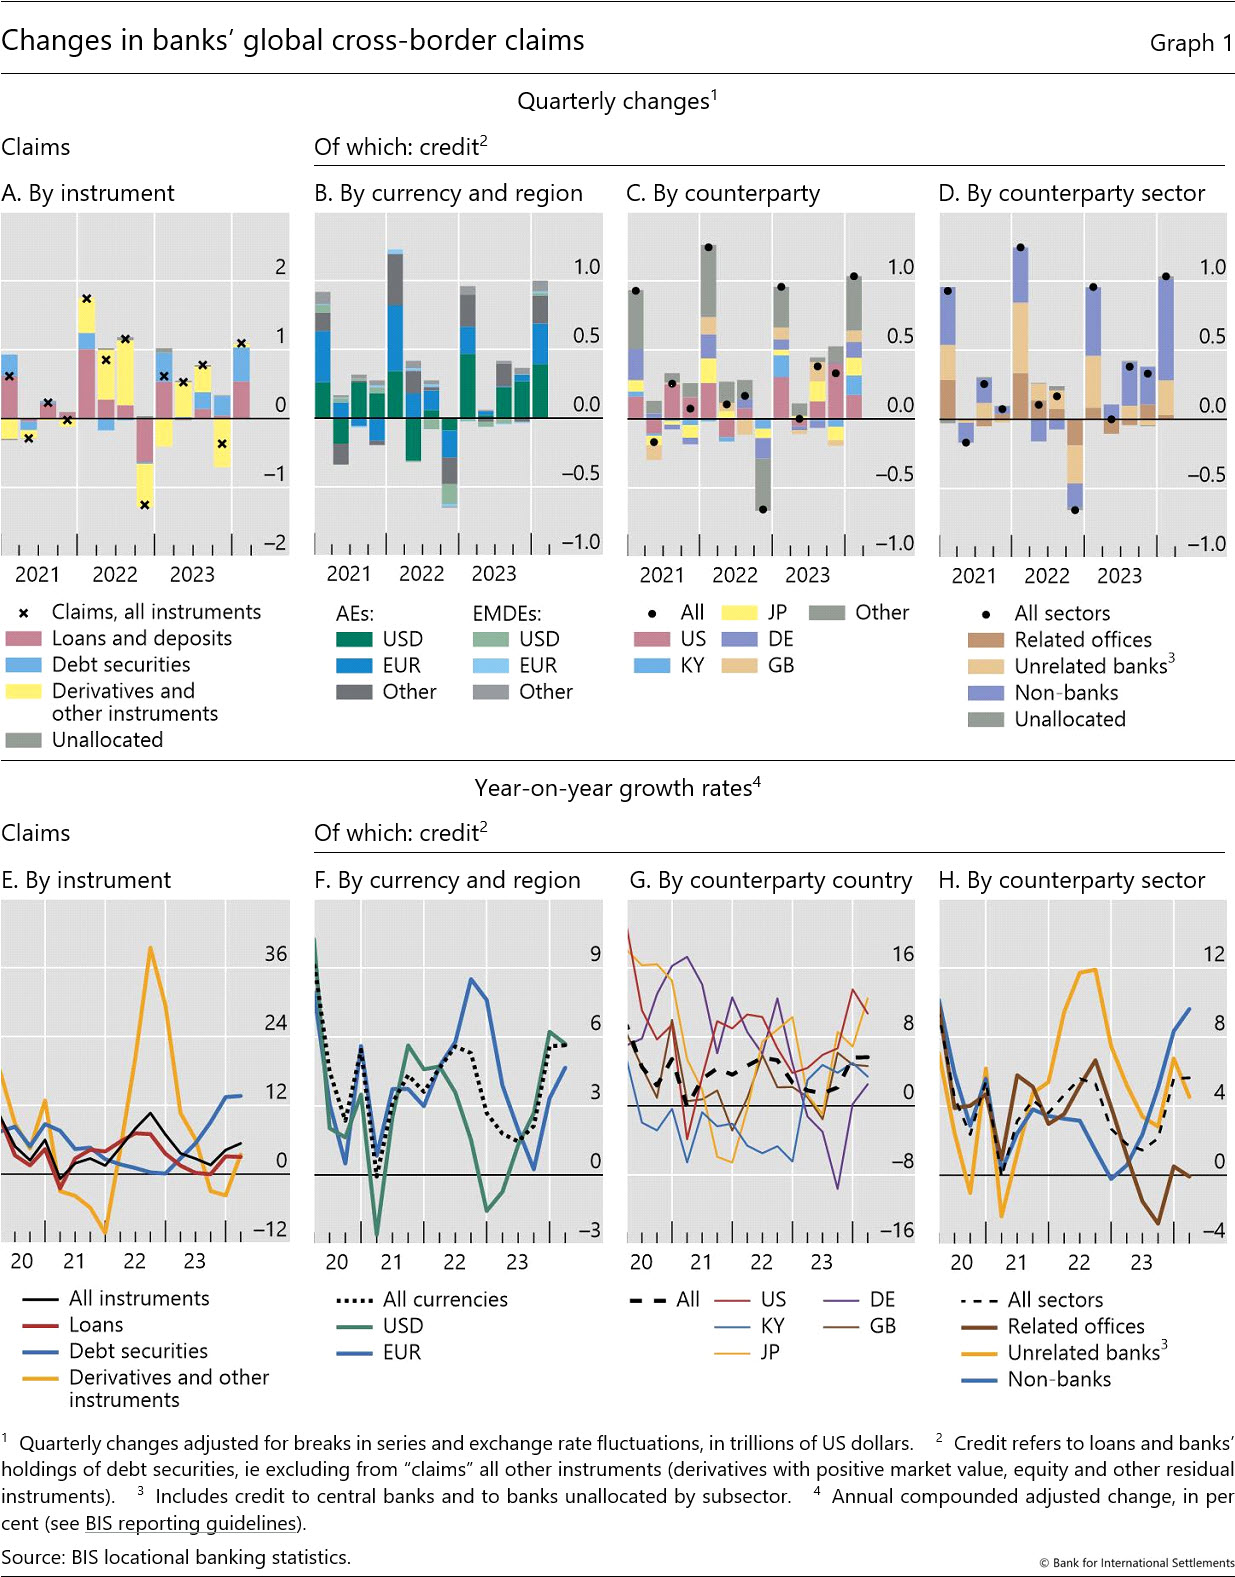
The BIS locational banking statistics (LBS) show that banks' global cross-border claims rose by $1.1 trillion over Q1 2024 on a foreign exchange and break-adjusted basis.1 Their outstanding stock reached $39.6 trillion, representing 5% yoy growth (Graphs 1 and Annex Graph A.1). The Q1 surge reflected mainly greater credit, which includes loans and holdings of debt securities (Graphs 1.A and 1.E) but excludes the market value of derivatives and other instruments. Credit to the United States and other major AEs contributed the most to the overall Q1 rise (Graph 1.G).
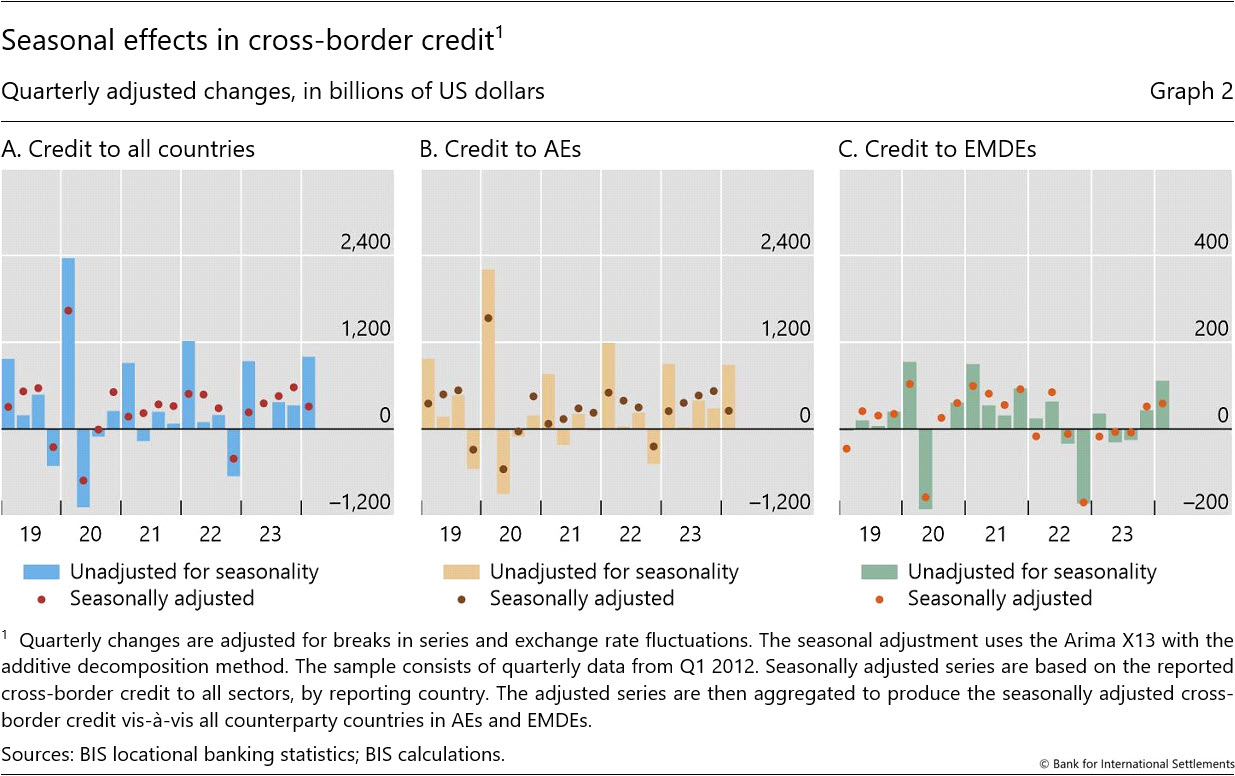
At the same time, the latest quarterly rise in cross-border credit was mostly due to seasonal factors that are particularly important for reporting banks in some jurisdictions (eg France and Germany) (Graph 2.A). Such banks tend to contract their positions towards year-end for accounting reasons, only to expand them again the following quarter.2 Seasonal effects appear to have accounted for around 70% of the overall $1.0 trillion expansion of credit in Q1, leaving the estimated underlying increase at a more modest $310 billion (blue bars vs adjusted changes shown as dots).
Credit to non-banks continues to rise
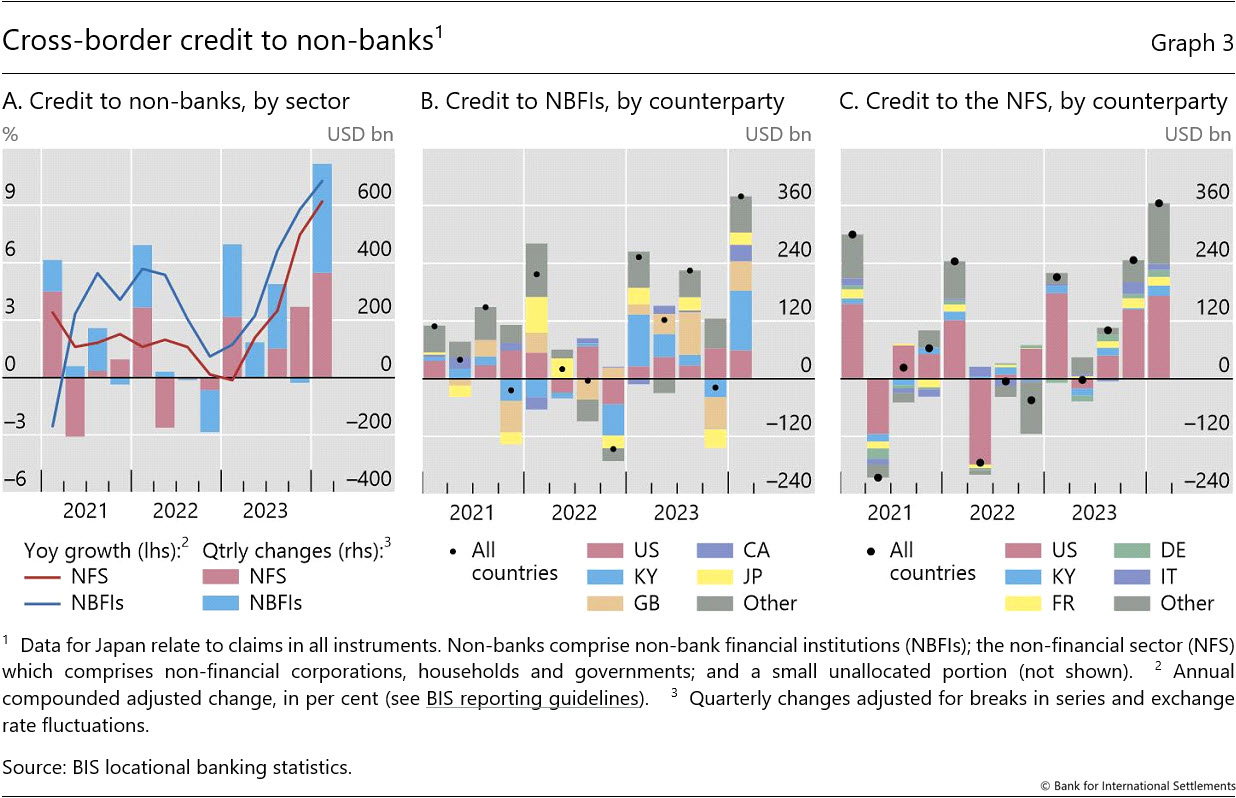
Much of the rise in global cross-border credit during Q1 was driven by lending to non-bank borrowers, furthering the trend observed in recent quarters (Graph 1.D). As a result, credit to non-banks is now growing by 10% yoy, a rate not seen since early 2020 (Graph 1.H).
Within the non-bank sector, credit to non-bank financial institutions (NBFIs) rose the most in Q1 (Graph 3.A). Much of this increase reflected credit to NBFIs residing in the Cayman Islands and, to a lesser extent, in the United Kingdom and the United States (Graph 3.B). As a result, the yoy growth in credit to the NBFI sector rose to 10%, up from 9% in the previous quarter and 1% at end-2022.
Bank credit to the non-financial sector also expanded noticeably in Q1, pushing the yoy growth rate to 9% (Graph 3.A). Much of this reflected greater credit to the non-financial sector in the United States (Graph 3.C), as banks located in other major AEs (eg France) reported greater holdings of government bonds.3
Growth in cross-border credit to EMDEs strengthens in Q1
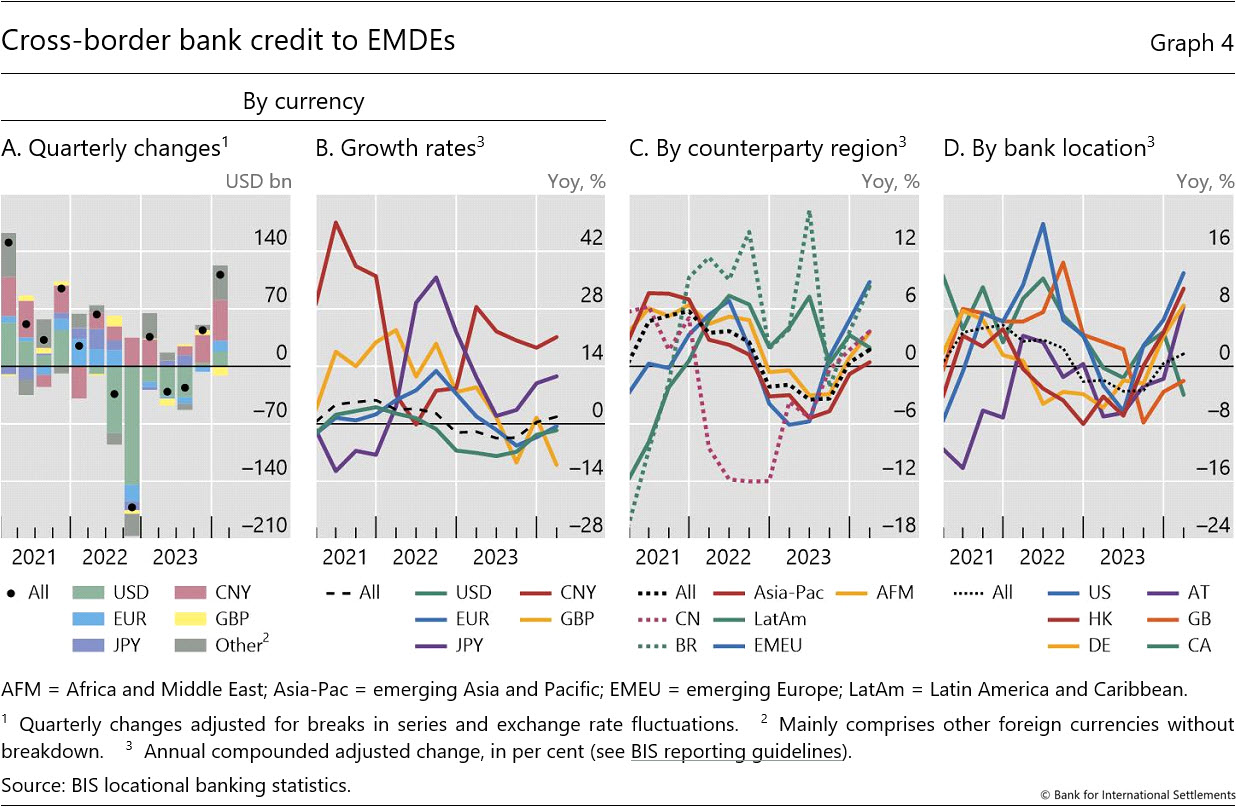
Cross-border bank credit to EMDEs rose by $111 billion during Q1 2024, the largest quarterly increase observed in the past three years (Graph 4.A). This pushed the yoy growth rate to 2% (Graph 4.B). Banks located in the United States, Hong Kong SAR and Germany drove the overall increase (Graph 4.D). Credit in Chinese renminbi grew by a record $49 billion during the quarter (Graph 4.A).4
Developments in credit diverged somewhat across the main regions. Credit to the Asia-Pacific region expanded by $64 billion in Q1 2024, pushing the yoy growth rate of credit into positive territory (Graph 4.C). Elsewhere, credit to borrowers in Africa and the Middle East expanded by $29 billion in Q1 (4% yoy), outpacing the expansion in credit to emerging Europe (+$12 billion or 9% yoy). Cross-border credit to Latin America grew by 2% yoy, driven by credit to borrowers in Brazil (+8% yoy).
Global liquidity indicators at end-March 2024
The BIS global liquidity indicators (GLIs) track total credit to non-bank borrowers, covering both loans extended by banks and funding from international bond markets. The latter is captured through the net issuance (gross issuance less redemptions) of international debt securities (IDS). The focus is on foreign currency credit denominated in the three major reserve currencies (US dollars, euros and Japanese yen) to non-residents, ie borrowers outside the respective currency areas.5
Foreign currency credit denominated in US dollars and euros inched up over Q1 2024, while yen credit barely changed. The $269 billion quarterly increase in dollar credit to non-banks outside the United States drove the outstanding stock slightly above $13 trillion (Graph 5.A, solid red line). As a result, the growth rate recovered to 2% yoy (Graph 5.B, red line). Euro credit to non-banks outside the euro area increased by €118 billion, which pushed the stock of credit just above €4.2 trillion ($4.6 trillion), or 5% higher than a year earlier (Graphs 5.A and 5.B, solid blue lines). Yen credit to non-banks outside Japan fell slightly in Q1, with the stock remaining close to ¥64 trillion ($429 billion). Nevertheless, rapid growth in previous quarters still left the stock 15% higher than a year ago (Graph 5.B, solid yellow line).
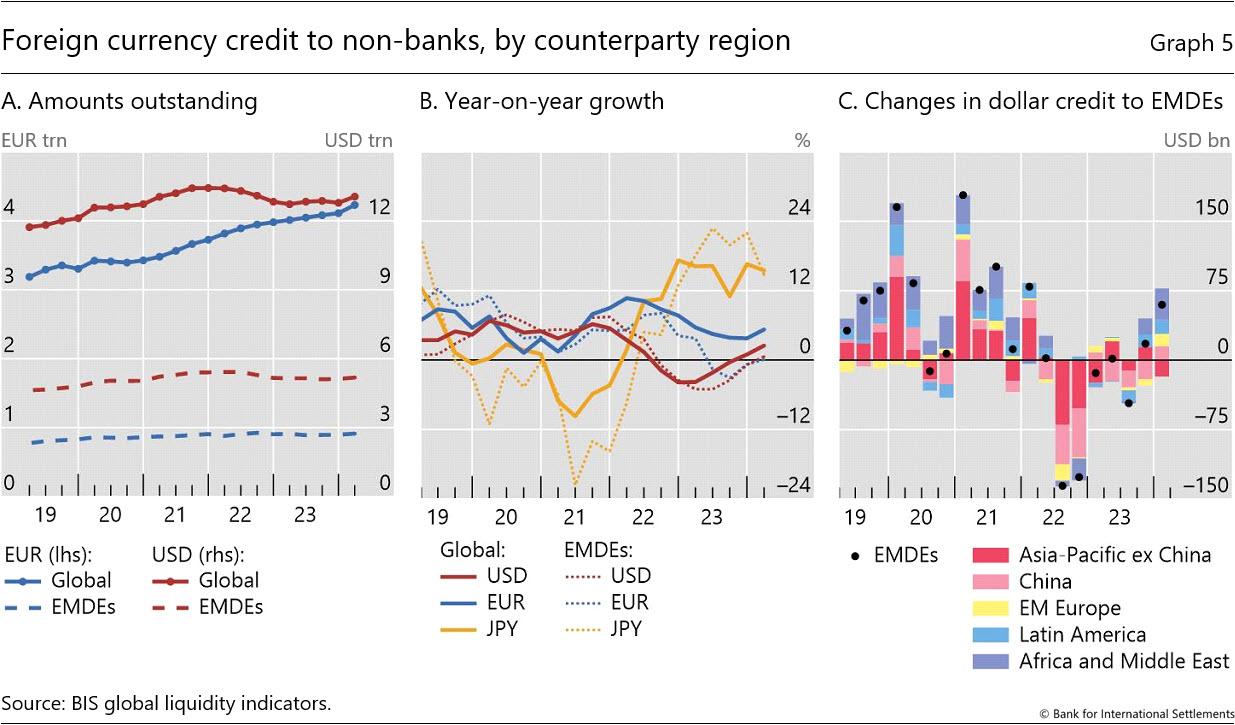
Dollar credit to non-banks in EMDEs strengthened further in Q1 2024, fuelled by an increase in bond financing. The $60 billion increase in dollar credit left the stock at $5.2 trillion (Graph 5.A). At 1%, yoy credit growth turned positive for the first time in almost two years (Graph 5.B). Looking across regions, dollar credit to non-bank borrowers in Africa and the Middle East rose the most in Q1, followed by credit to those in Latin America and emerging Europe. Dollar credit to emerging Asia-Pacific fell slightly despite an increase of $15 billion to non-banks located in China (Graph 5.C).
Since the Great Financial Crisis of 2007-09 non-bank borrowers have increasingly turned to international bond financing rather than to bank loans (Graph 6.A).6 The share of bond financing in dollar and euro credit has risen by 14 and 13 percentage points, respectively, since late 2008 (solid red and blue lines). By contrast, the share of bonds in outstanding yen credit on all non-bank borrowers has dropped by 18 percentage points since 2008 (solid yellow line).
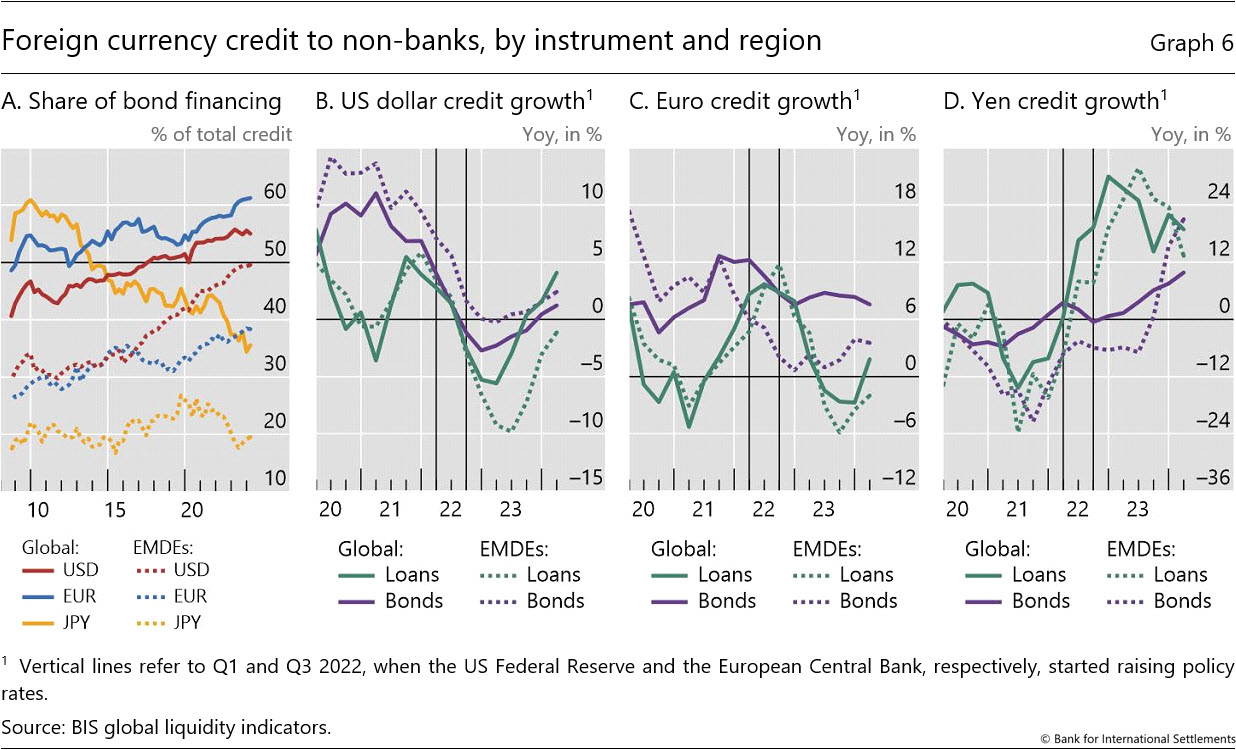
These general patterns remained even during the broad monetary policy tightening observed after early 2022.7 Higher US policy rates led to a stronger dollar throughout 2022, weighing on dollar-denominated credit (Graph 6.B), but growth in bond financing (purple lines) held up better than bank lending (green lines) through mid-2023. In the euro segment, growth in bond issuance remained positive after the European Central Bank raised policy rates from July 2022 onwards (Graph 6.C). As a result, the euro bond share reached 61%, the highest on record (Graph 6.A). Only for global yen credit did loan growth consistently outpace bond issuance in recent years (Graph 6.D).
1 In the BIS LBS, bank claims comprise (i) loans and deposits, (ii) holdings of debt securities and
(iii) derivatives with a positive market value and other residual instruments (combined). Credit is defined as the sum of (i) and (ii).
2 In most BIS reporting jurisdictions, the fiscal year closes at the end of the calendar year. However, in some (eg Japan), it closes at end-March.
3 Thirty of 46 countries report holdings of government debt securities. China, Hong Kong SAR, Japan and the United States are among the countries that do not report this breakdown of the non-financial sector.
4 Borrowers in China and Hong Kong SAR received a combined $45 billion in CNY-denominated funds (Graph 4.C).
5 "Global credit" in this section refers to credit to those economies outside the respective currency area.
6 See also B Hardy and G von Peter, "Global liquidity: a new phase?", BIS Quarterly Review, December 2023, pp 21-31.
7 See also the April 2024 statistical release for a commentary on the effect of funding costs and associated exchange rate developments on credit growth.