BIS residential property price statistics, Q1 2024

Key takeaways
- The fall in global house prices moderated further in the first quarter of 2024, at 1.0% year on year (yoy) in aggregate and in real terms.
- In more than half of the economies, real prices were already increasing compared with the same period one year earlier, showing high heterogeneity.
- Real house prices have declined further in emerging market economies (EMEs) (-1.6% yoy), while having almost stabilised in advanced economies (AEs) (-0.3% yoy).
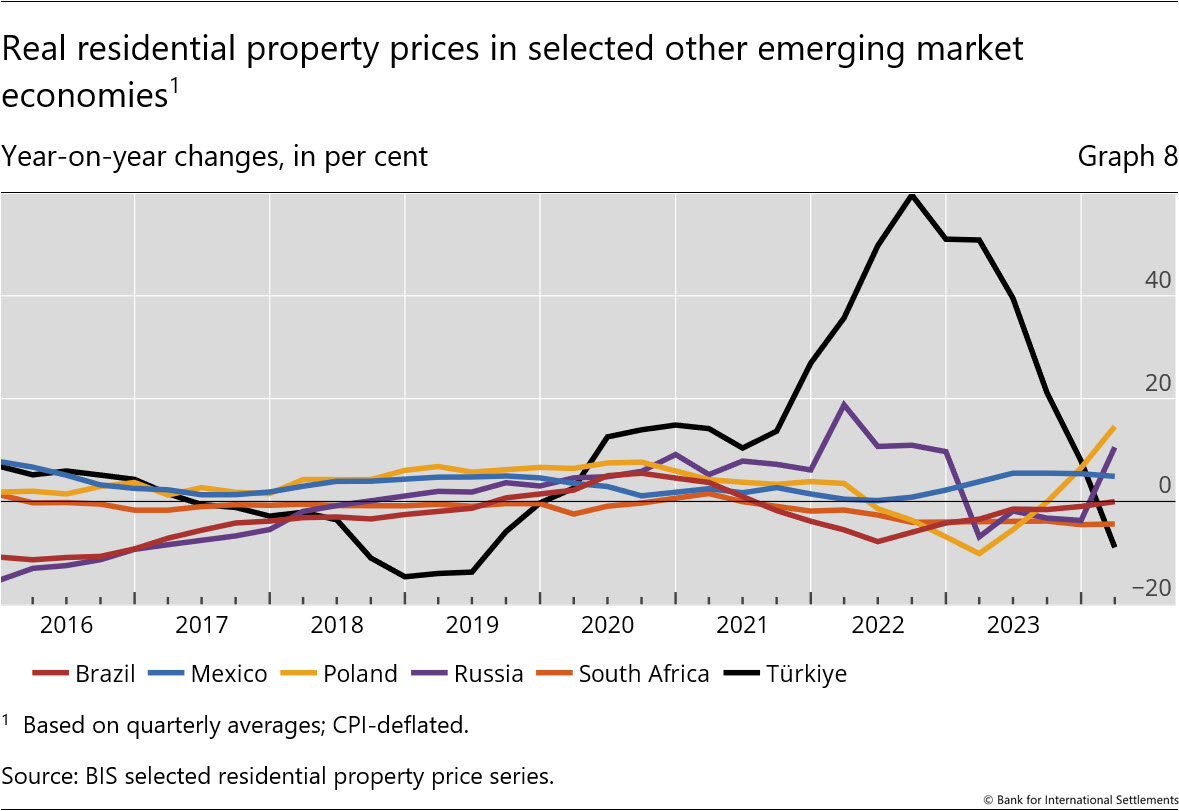
- Considerable differences persist across major economies. For instance, real house prices surged in Australia, Mexico and also increased in the United States in Q1 2024. At the other end of the scale, prices fell sharply in China, Korea and even more so in Türkiye.
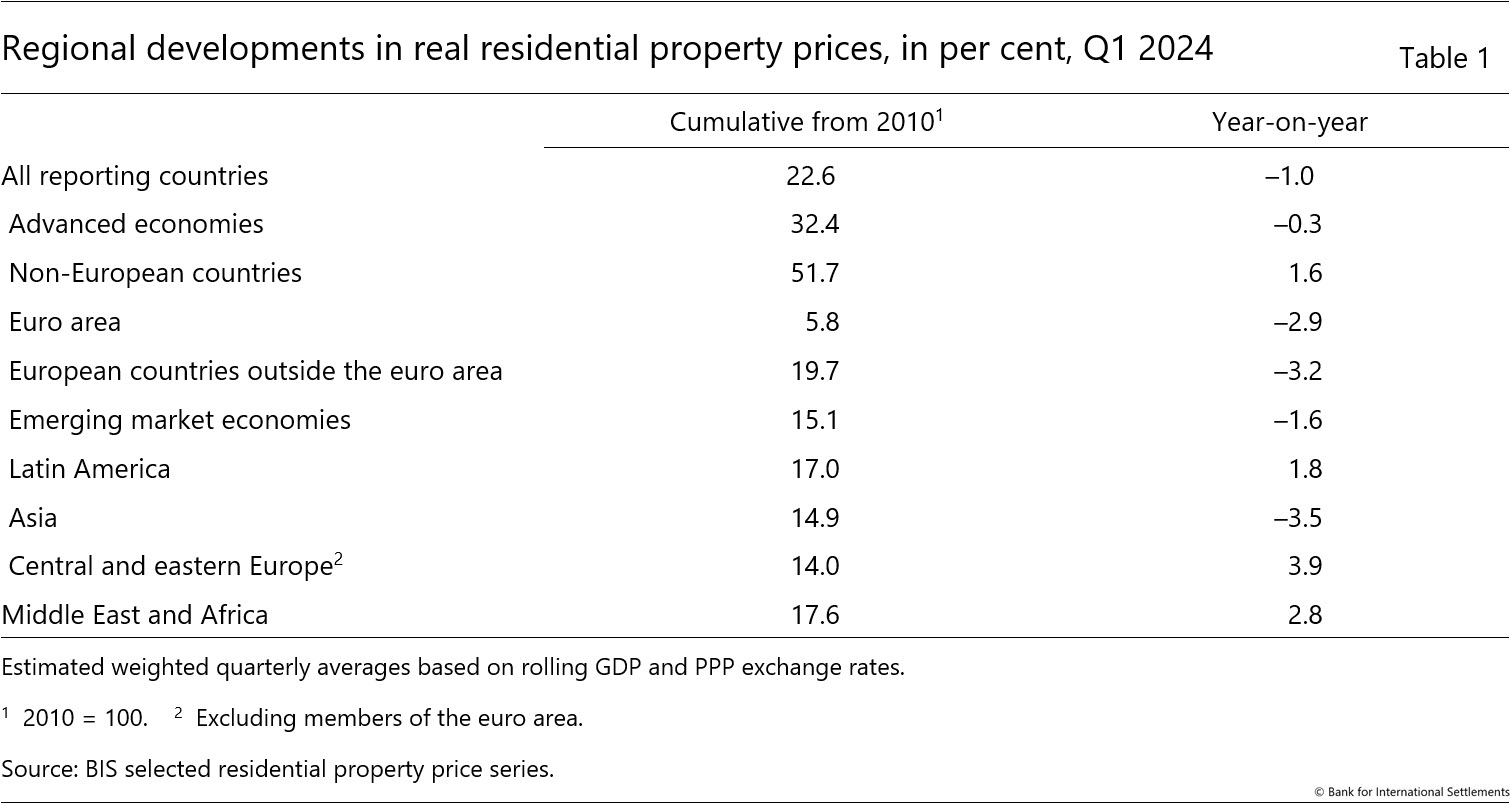
- In real terms, global house prices remain significantly (23%) above their average level observed since the 2007-09 Great Financial Crisis (GFC) - by 32% in AEs and 15% in EMEs.
Summary of latest developments
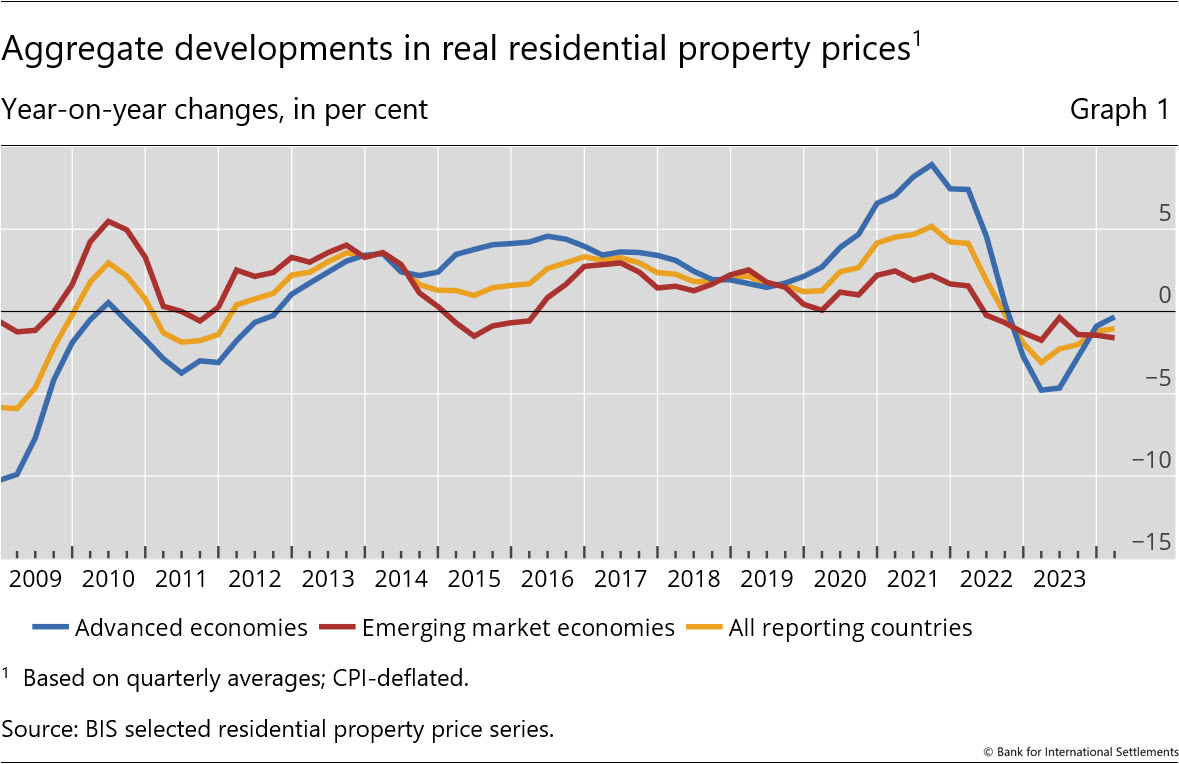
In the first quarter of 2024, global house prices deflated by consumer prices declined by 1.0% yoy, compared with 1.2% in the last quarter of 2023.1 Prices continued to increase in nominal terms (by 2.9%).
The decline in real house prices nearly came to a halt in AEs, moderating to 0.3% yoy in Q1 2024, compared with 0.9% yoy in the previous quarter. In contrast, prices continued to fall in EMEs, by 1.6% yoy after 1.4% in Q4 2023 (Graph 1). This reflected a further decline in Asia, only partially offset by price increases in other regions.
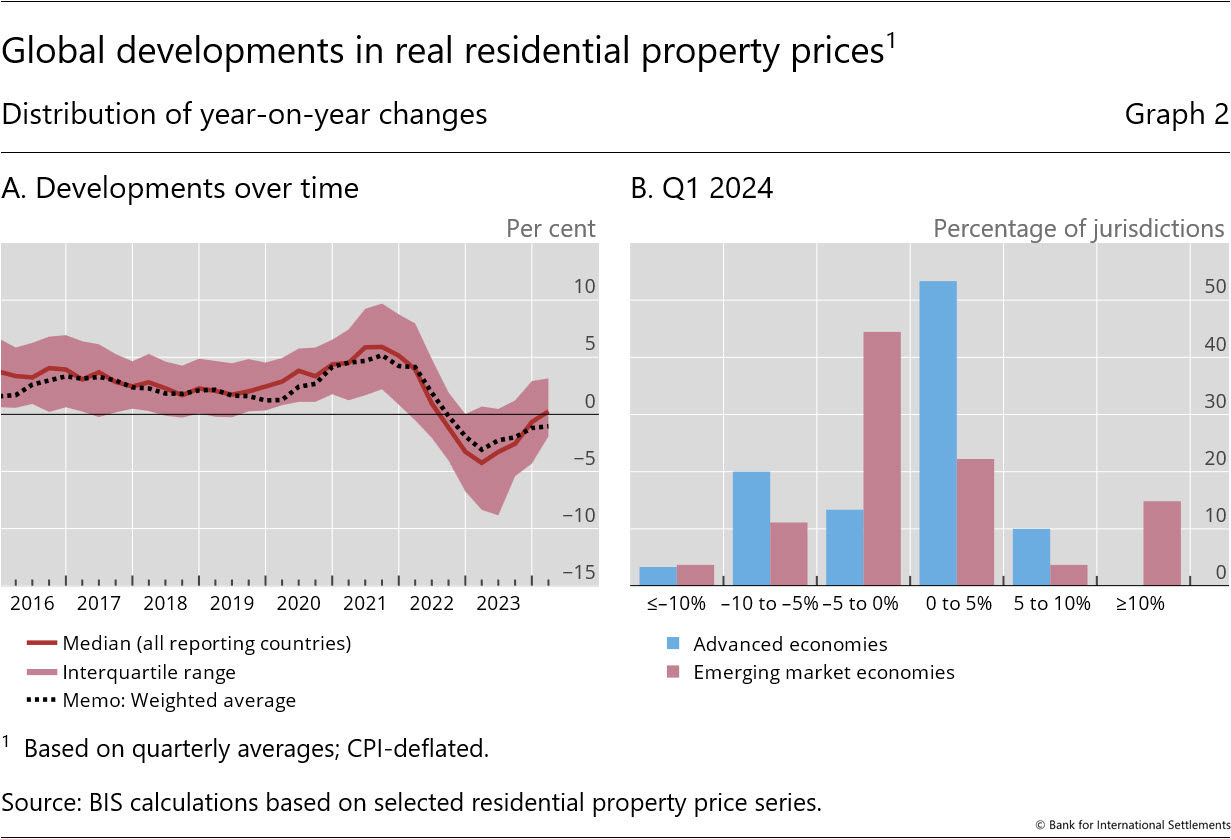
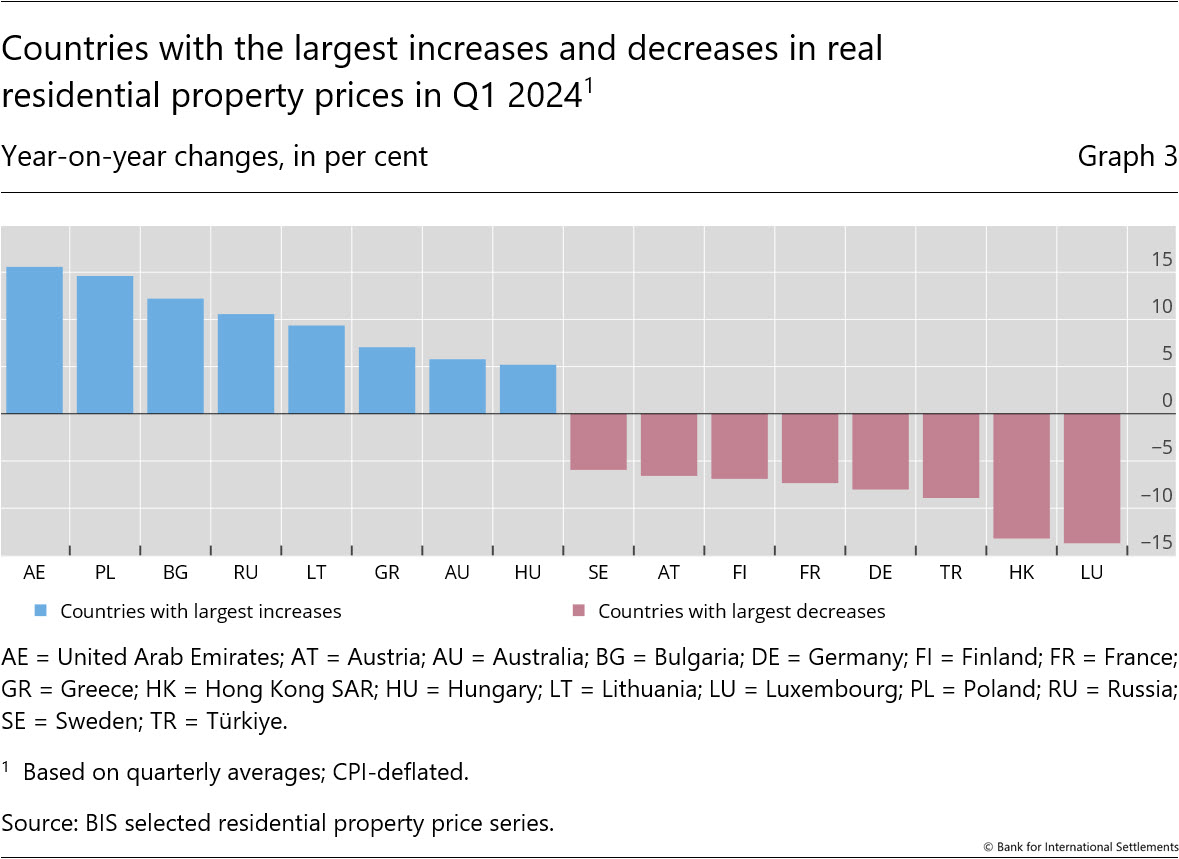
Country-level data provide interesting insights into the global picture of moderating house price deflation. In fact, prices already grew in more than half of the economies (65% of the AEs and 40% of the EMEs) in Q1 2024, and the median price growth observed for all jurisdictions became slightly positive (+0.3%) for the first time since mid-2022 (Graph 2A). This suggests that the observed continuous decline in global real house prices is now primarily driven by a few major jurisdictions, in particular China and the euro area. Looking more closely at the distribution, real prices declined by 5% or more in one fifth of the economies monitored (Graph 2.B). Prices fell the most in Luxembourg (-14%), Hong Kong SAR (-13%) and Türkiye (-9%) (Graph 3). In contrast, 15% of the economies saw real house price growth exceeding 5%, including the United Arab Emirates (+16%), Poland (+15%) and Bulgaria (+12%).2
Global real residential prices are still 5% above their levels observed before the onset of the Covid-19 pandemic. Compared with Q4 2019, they have increased by close to 120% in Türkiye, 21% in the United States, around 15% in Japan and Australia, and 13% in Mexico. In contrast, real prices have experienced declines of 10% in South Africa, 9% in China and India and 8% in Germany (Graph 4).
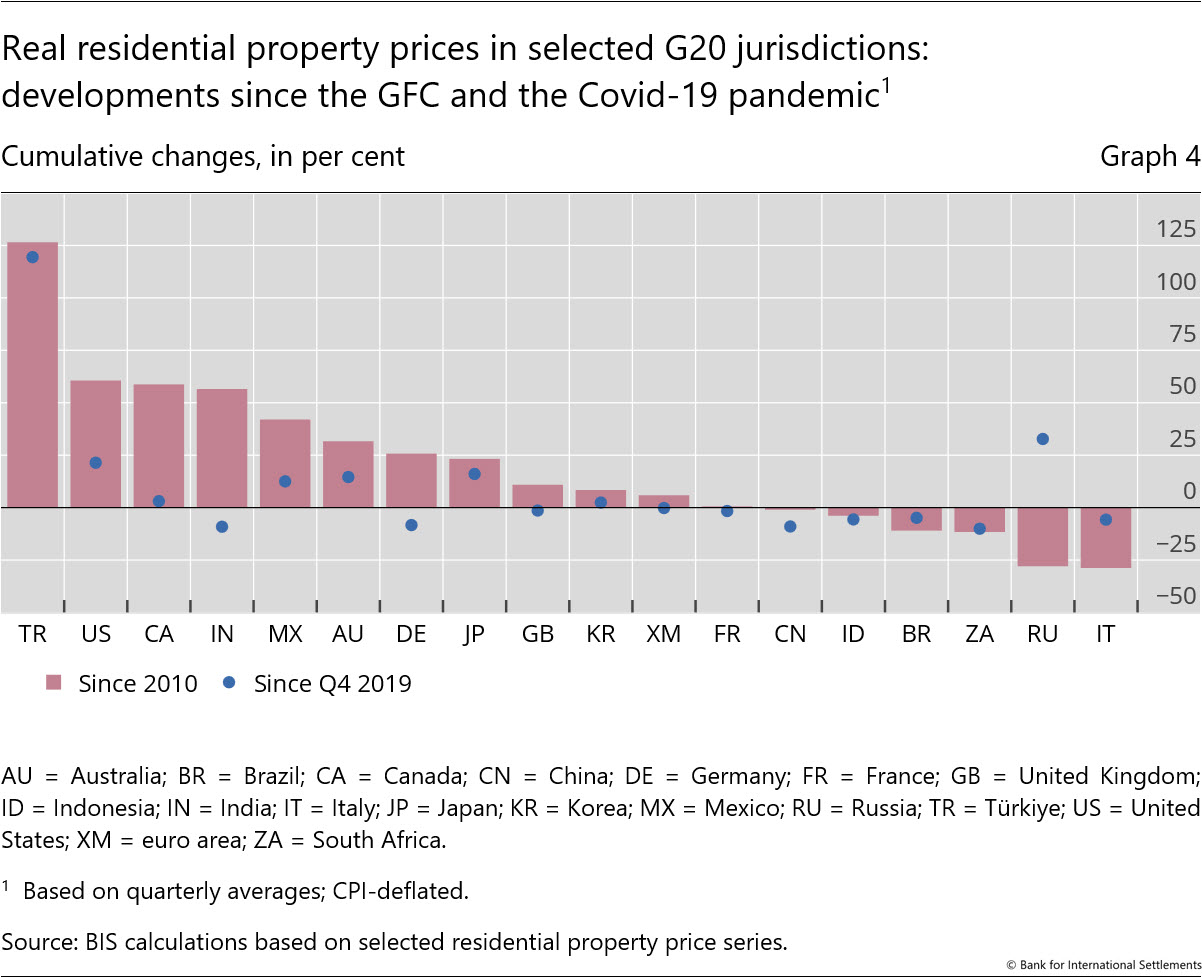
From a longer-term perspective, global house prices exceed (in real terms) their immediate post-GFC average by 23% (32% for AEs and 15% for EMEs) (Table 1). Among G20 economies, real prices have more than doubled since 2010 in Türkiye and risen by more than 50% in Canada, the United States and India. At the other end of the scale, they remain well below their post-GFC levels in Italy, by 29%.
Advanced economies
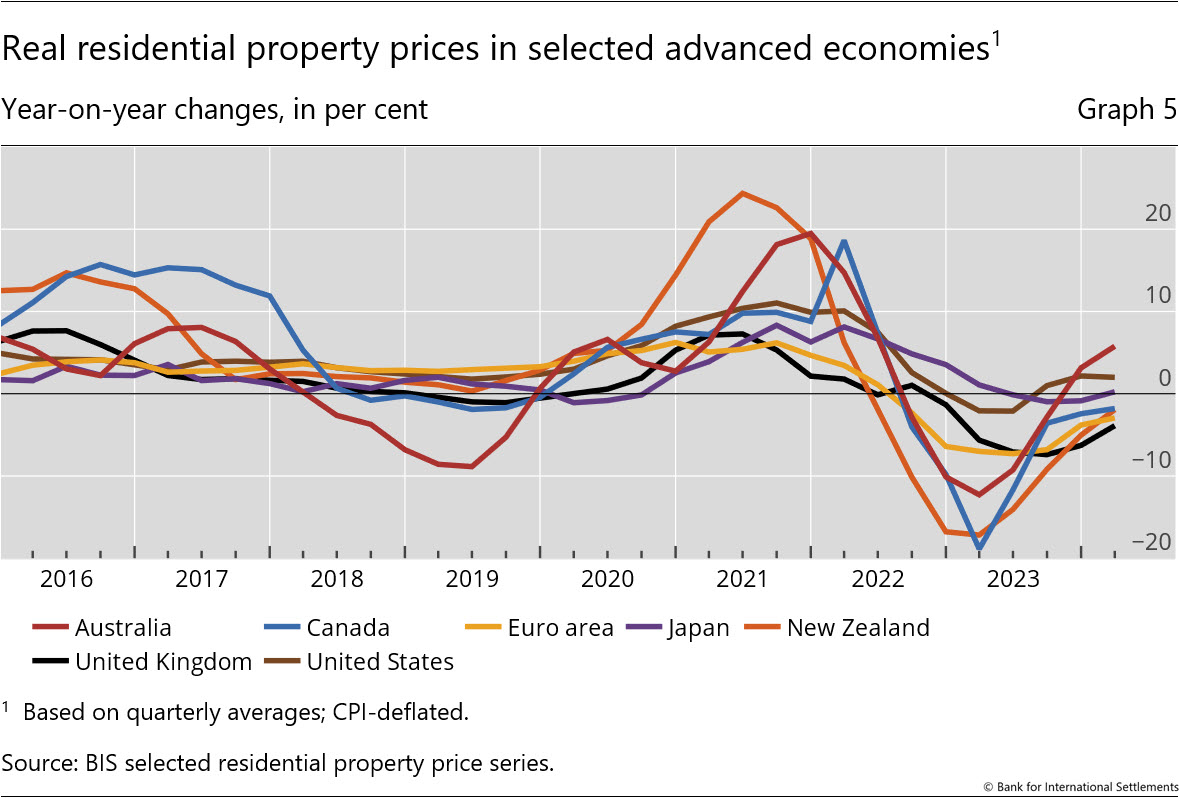
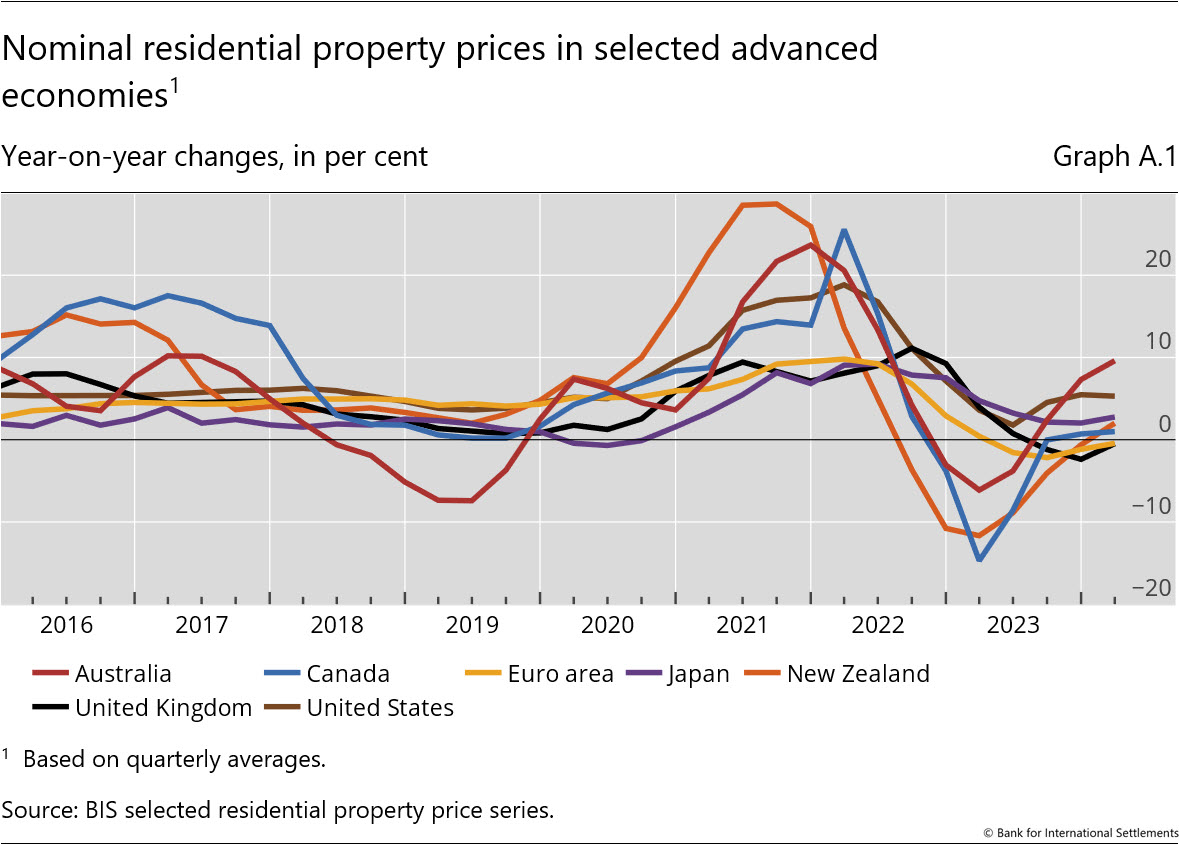
In aggregate for the group of AEs, real residential property prices were almost stable with a 0.3% yoy fall in Q1 2024, marking a further moderation from the 0.9% drop observed in the previous quarter. Among major economies, real prices were up by 6% in Australia and 2% in the United States and were stable in Japan. They continued to fall in Canada (-2%), the euro area (-3%) and the United Kingdom (-4%) (Graph 5).
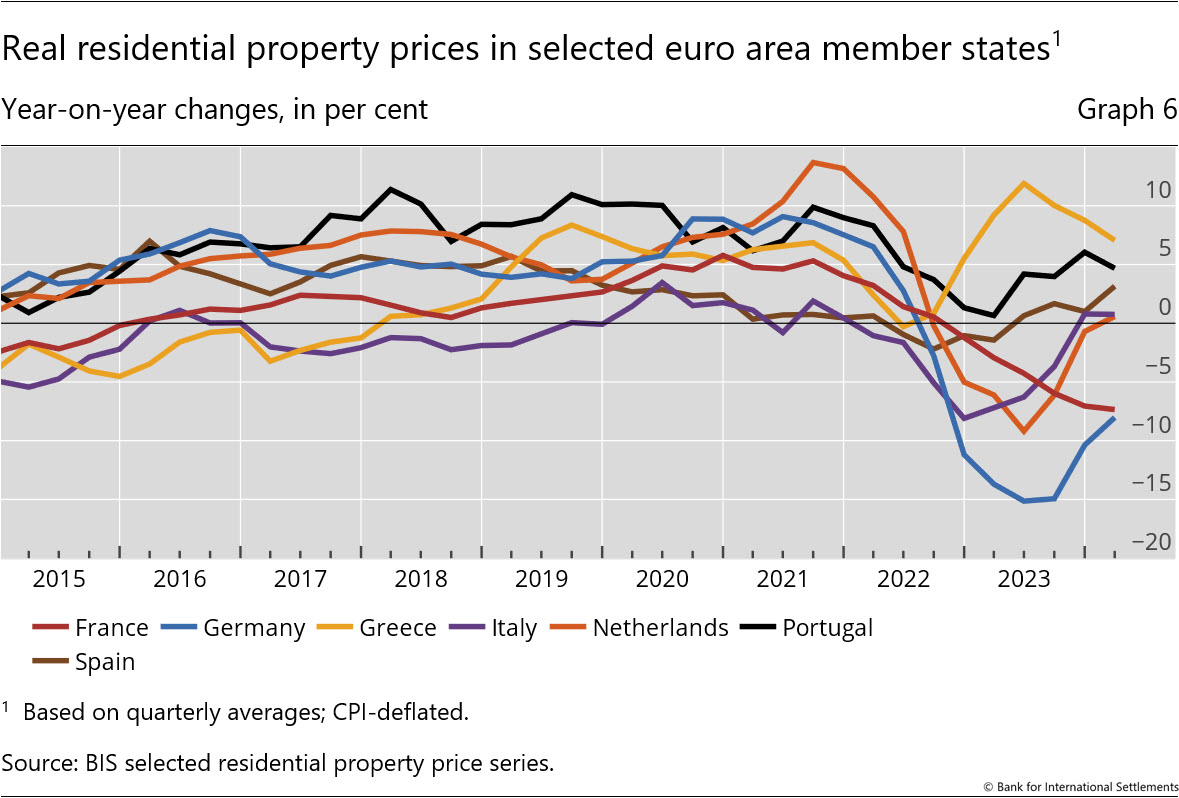
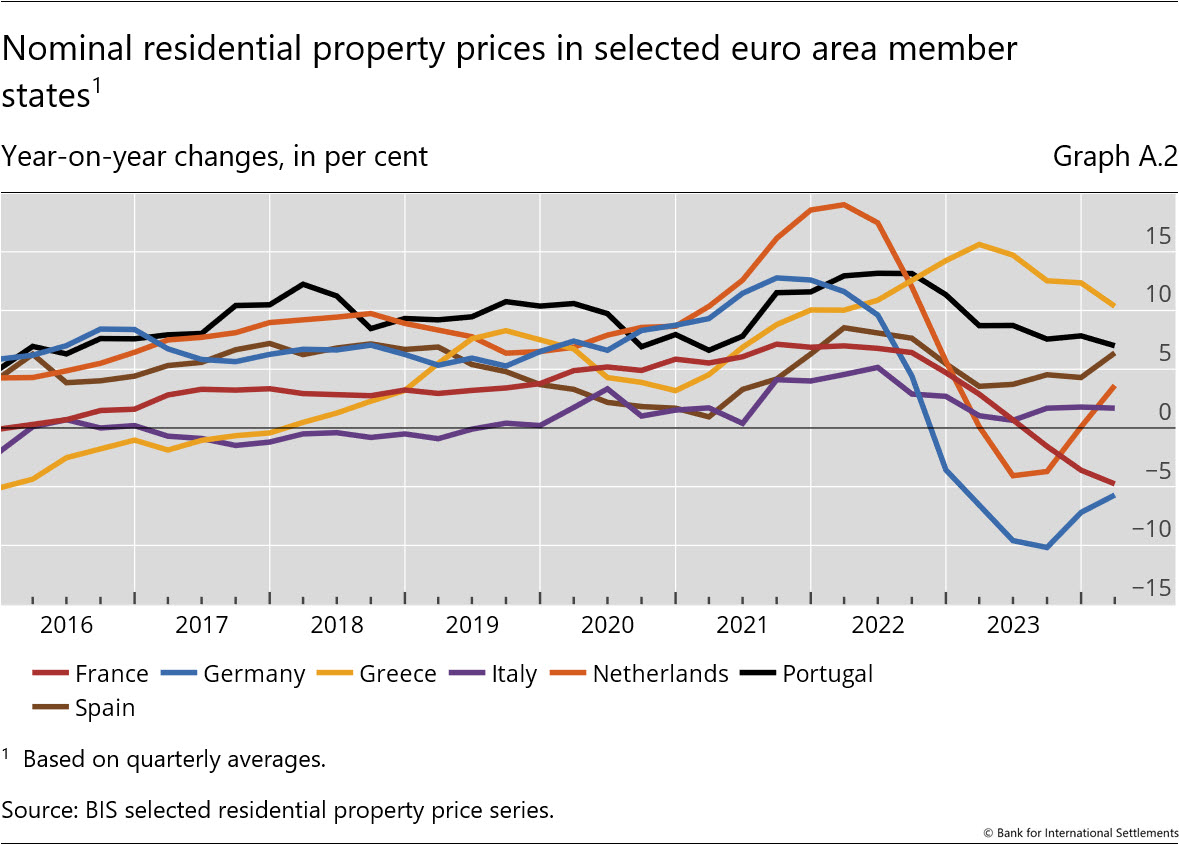
Within the euro area, real house prices continue to show significant variations among member states. They surged by 7% yoy in Greece and 5% in Portugal and increased more moderately in Spain (+3%). They were broadly stable in Italy and in the Netherlands (both +1%). In contrast, they declined by 7% in France and 8% in Germany (Graph 6).
Emerging market economies
Real residential property prices declined by 1.6% yoy in EMEs during the first quarter of 2024 (compared with 1.4% in Q4 2023), driven by the fall observed in Asia; in contrast, prices increased in all other regions.
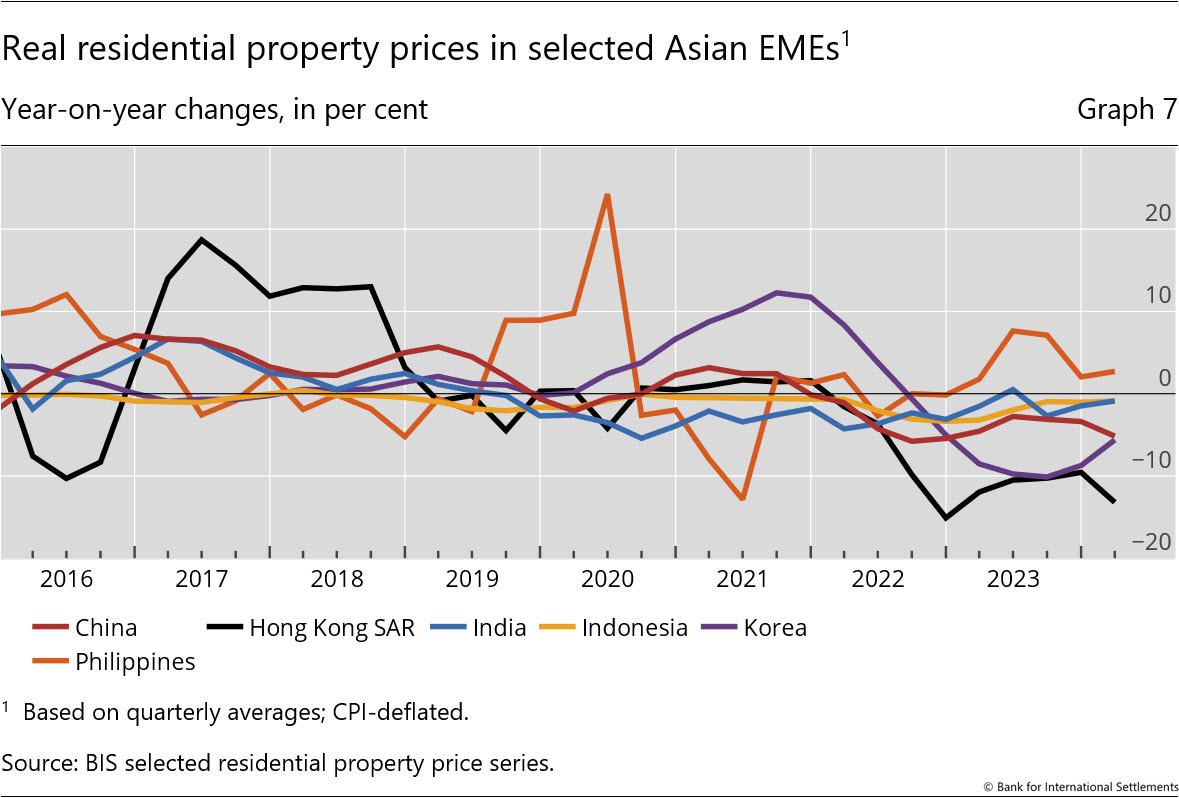
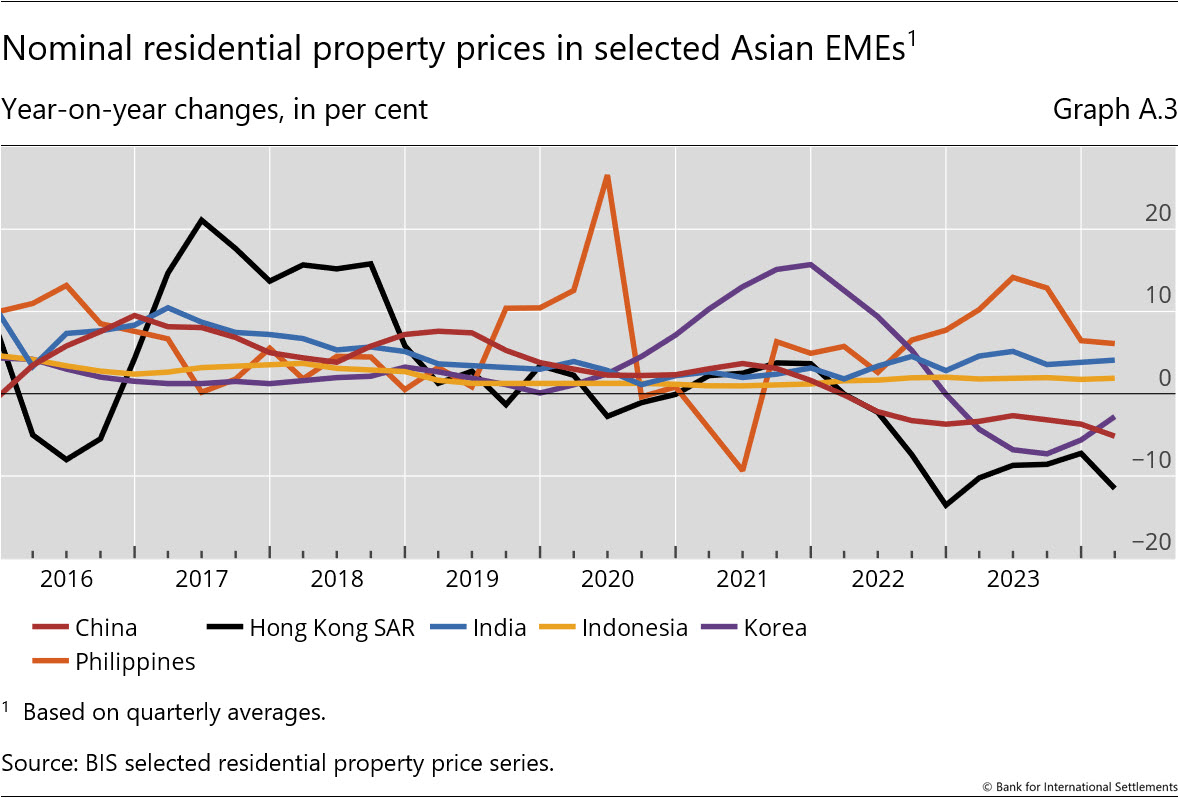
Prices fell by 3.5% on average in Asian economies, driven by a decline of 5% in China, 6% in Korea and a substantial 13% drop in Hong Kong SAR (Graph 7). In contrast, prices increased by 3% in the Philippines, and remained nearly stable in India and Indonesia.
Real prices rose by 1.8% in Latin America, mainly driven by a continued price increase in Mexico (+5%), while the price decline of recent years came to a halt in Brazil (0%). In central and eastern European countries, real prices grew by 3.9% in aggregate (with a 15% surge in Poland). Interestingly, prices declined for the first time in Türkiye (-9%), marking an end to the strong expansion observed after the Covid-19 pandemic (+137% from end-2019 to end-2023). Lastly, prices fell by 4% in South Africa (Graph 8).
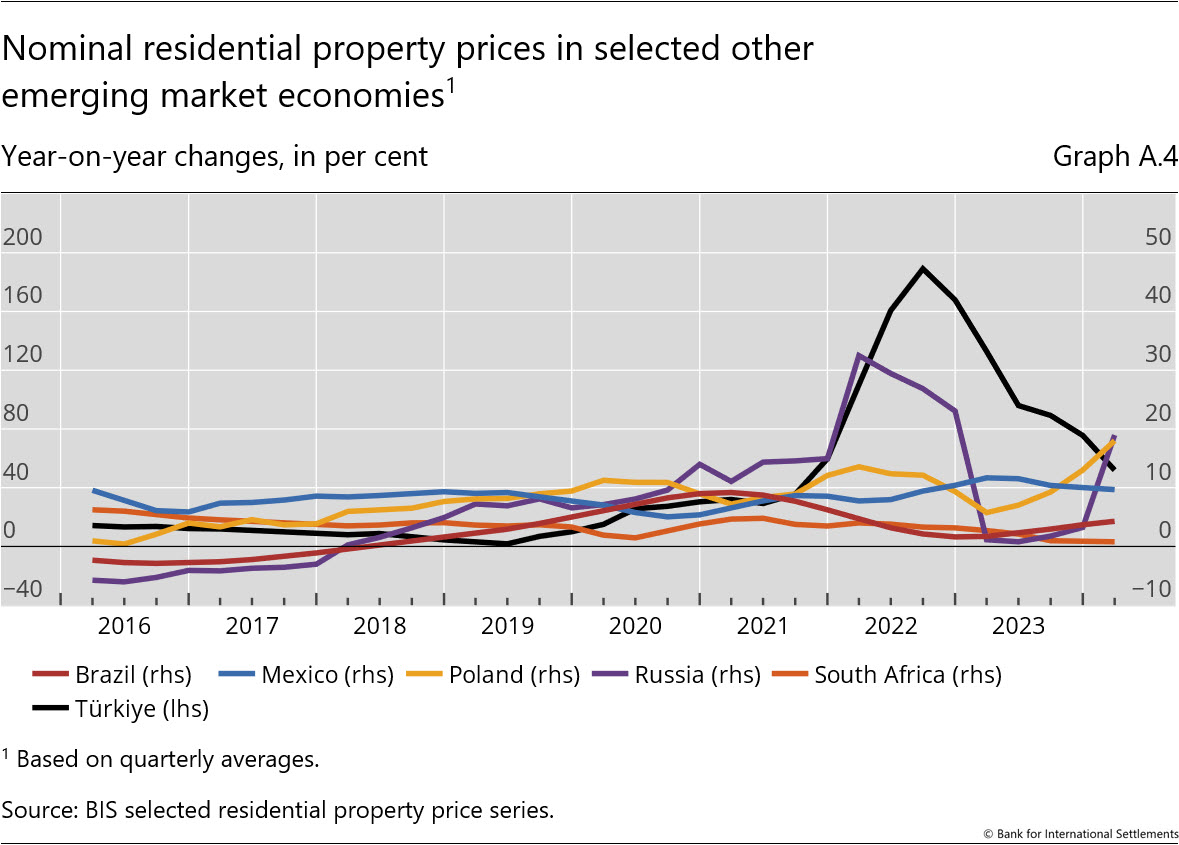
Annex: Nominal house price developments
1 Real residential property prices refer to nominal residential property price indicators deflated by the consumer price index. Global figures are weighted aggregates of selected AEs (Australia, Canada, Denmark, the euro area, Iceland, Japan, New Zealand, Norway, Sweden, Switzerland, the United Kingdom and the United States) and EMEs (Brazil, Bulgaria, Chile, China, Colombia, Czechia, Hong Kong SAR, Hungary, India, Indonesia, Israel, Korea, Malaysia, Mexico, Morocco, North Macedonia, Peru, the Philippines, Poland, Romania, Russia, Singapore, South Africa, Thailand, Türkiye and the United Arab Emirates), based on PPP exchange rates. Regional aggregates have been available since 2007.
2 As regional aggregate developments are driven mainly by changes in major economies, they can mask the detailed country-level features presented in the histogram.