BIS residential property price statistics, Q4 2023

Key takeaways
- The fall in global house prices moderated further in the fourth quarter of 2023, at 1.2% year on year (yoy) in aggregate and in real terms.
- Real house prices declined more in emerging market economies (EMEs) (-1.6% yoy) than in advanced economies (AEs) (-0.8% yoy), for the first time since late 2022.
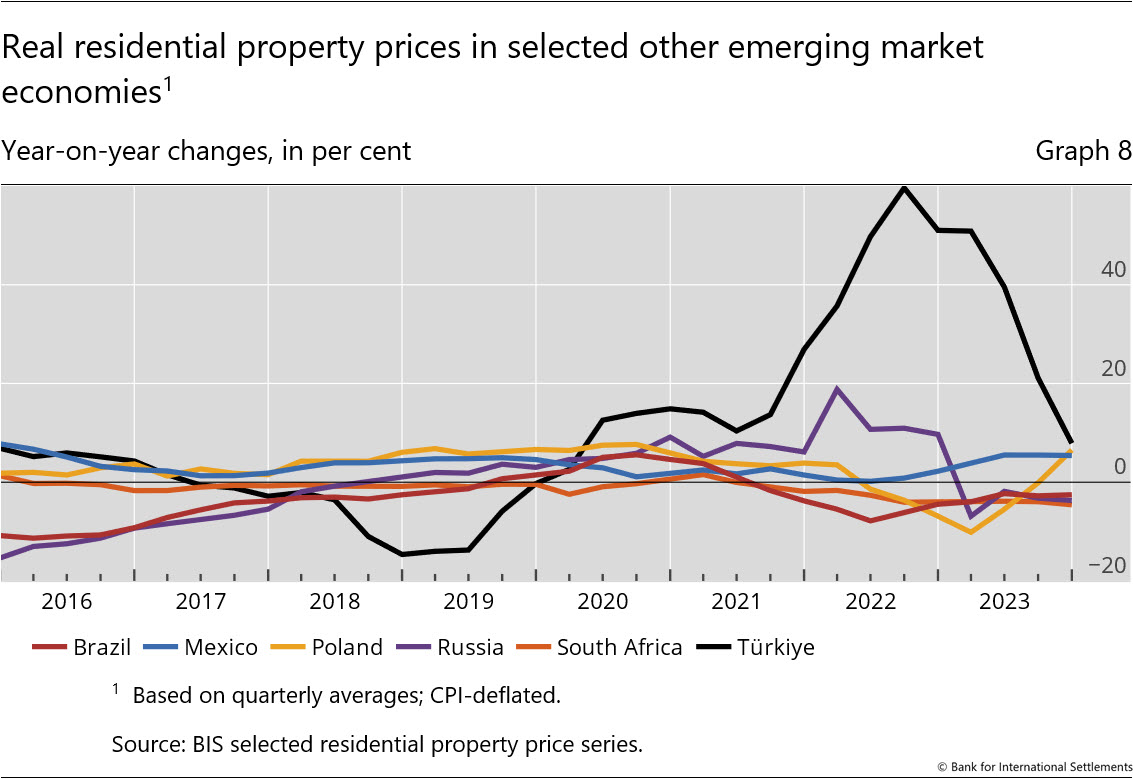
- Considerable differences still persist across major economies. For instance, real house prices continued to surge in Türkiye and Mexico, while they experienced moderate growth in Australia and the United States. Prices remained broadly unchanged in India, Indonesia and Japan. They fell moderately in Brazil, Canada, China and the euro area (notably Germany and France), and more sharply in South Africa, the United Kingdom and even more so in Korea.
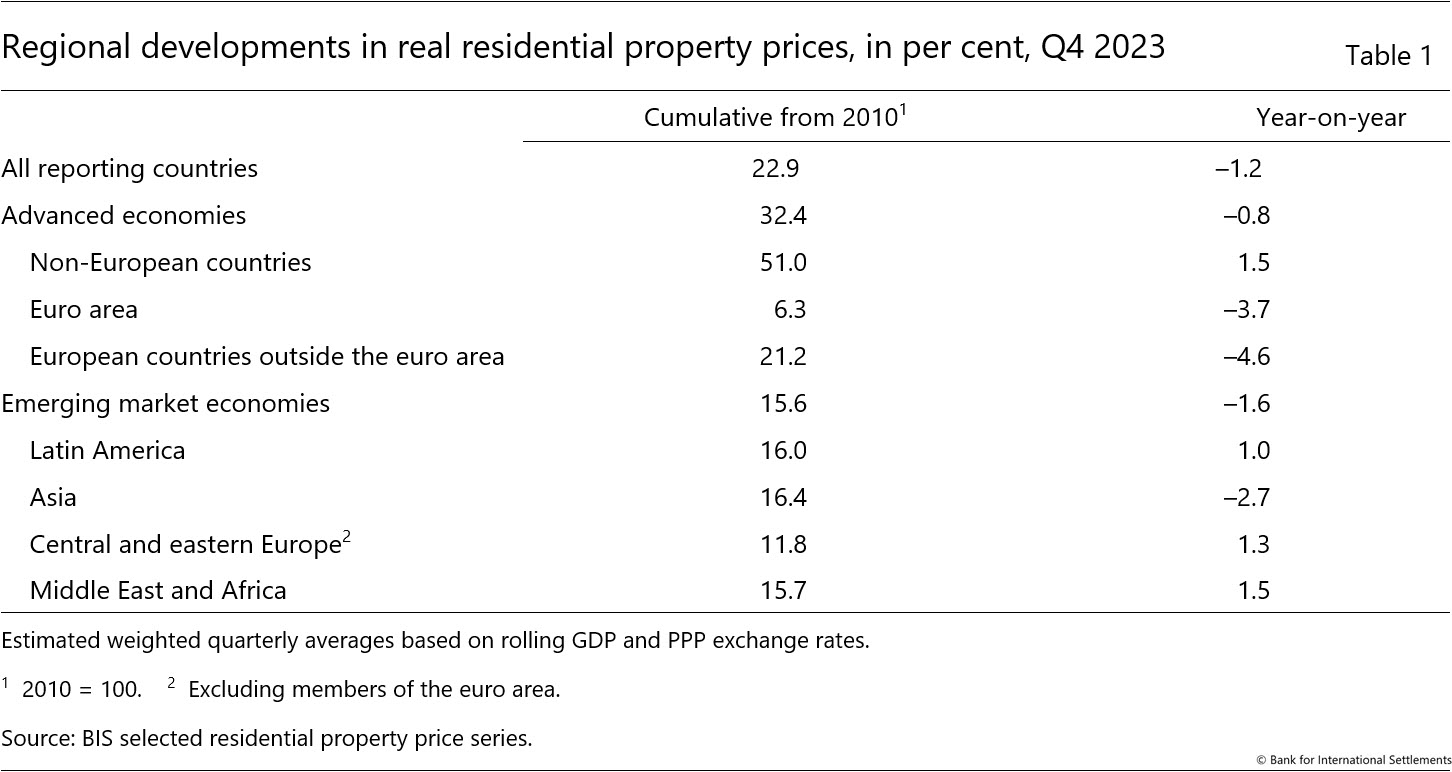
- In real terms, global house prices remain significantly (by 23%) above their average level observed after the 2007-09 Great Financial Crisis (GFC) by 32% in AEs and 16% in EMEs.
- The BIS has further expanded its commercial property price data set, now including indicators for Czechia, Türkiye and the United Arab Emirates for the first time (see the box).
Summary of latest developments
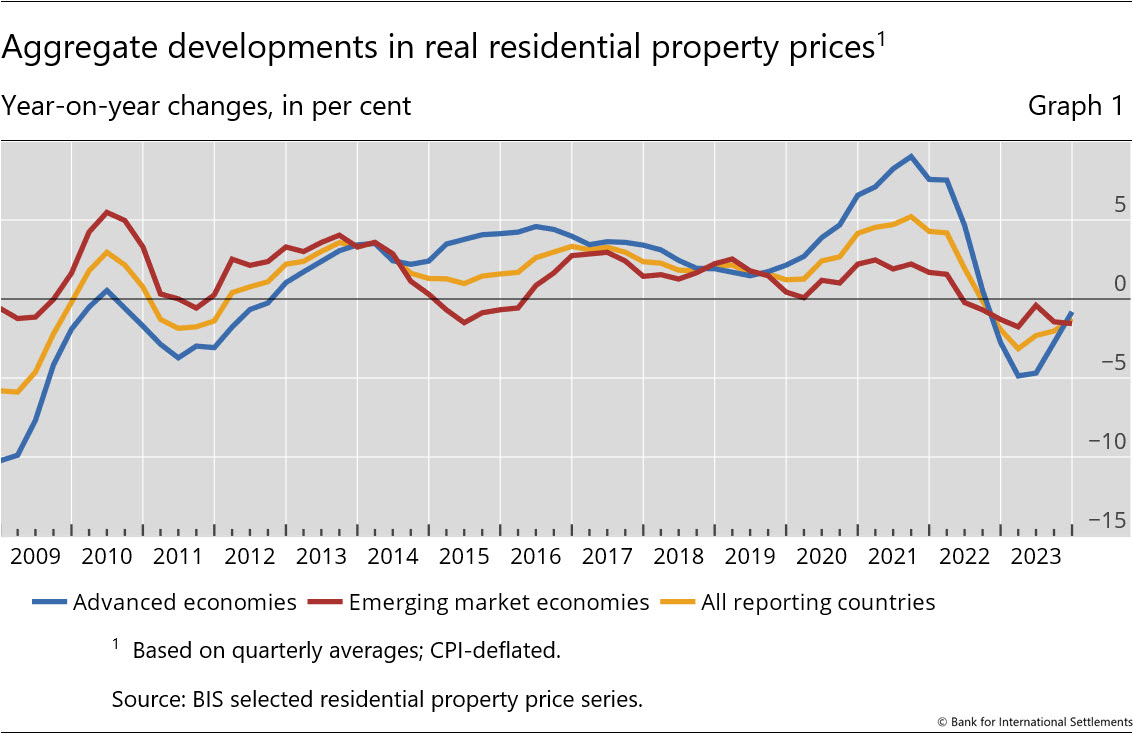
In the fourth quarter of 2023, global house prices deflated by consumer prices declined by 1.2% yoy, compared with 2.0% in the third quarter.1 This evolution in real terms reflected a further pickup in nominal terms (+2.8%, after +2.6%), combined with a significant moderation in consumer price (CPI) inflation.2
The decline in real house prices moderated to 0.8% yoy in AEs in Q4 2023, compared with -2.8% yoy in the previous quarter. In contrast, prices fell by 1.6% yoy in EMEs, slightly more than the 1.4% decline observed in Q3 2023 (Graph 1). As a result, and for the first time since late 2022, prices decreased more in EMEs than in AEs. This reflected a further decline in Asia (-2.7%), partially offset by moderate increases - ranging from 1% to 1.5% - in central and eastern Europe, Latin America and the Middle East and Africa region.
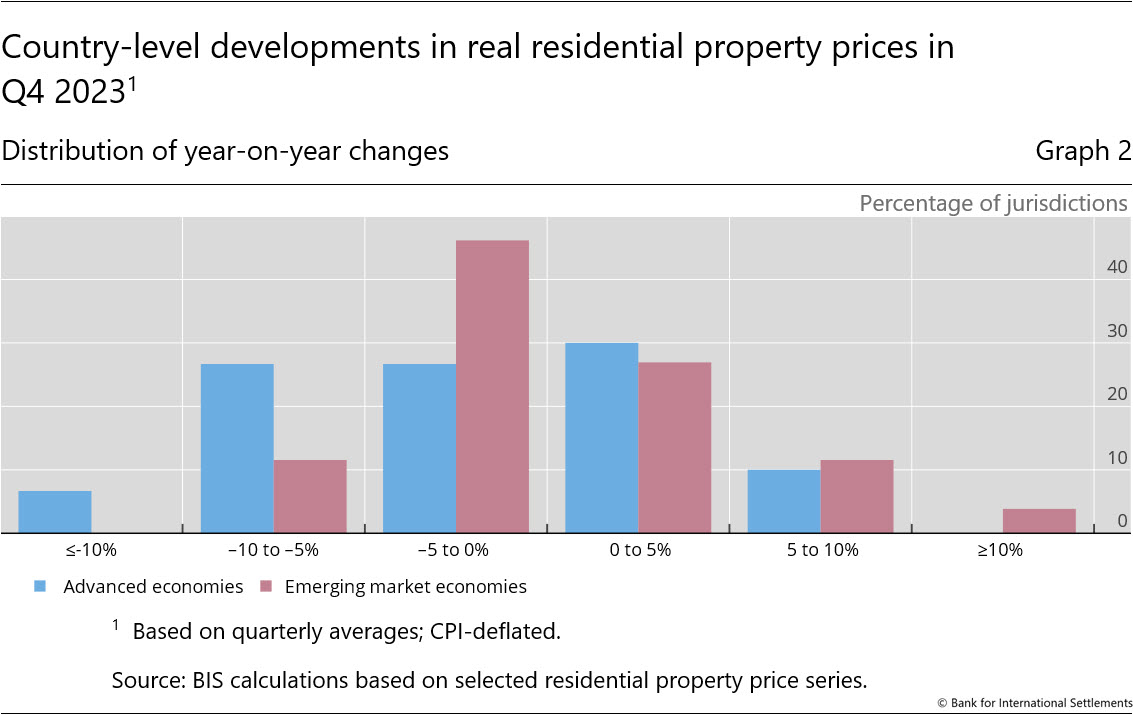
Country-level data reveal that in both AE and EME groups, approximately 60% of jurisdictions have witnessed a decrease in real house prices. But, and in contrast to previous quarters, only two economies registered a double-digit price fall (Graph 2).3 Real prices declined the most sharply in Luxembourg (-17%) and Germany (-10%), with Hong Kong SAR and Korea close to -10% (Graph 3).
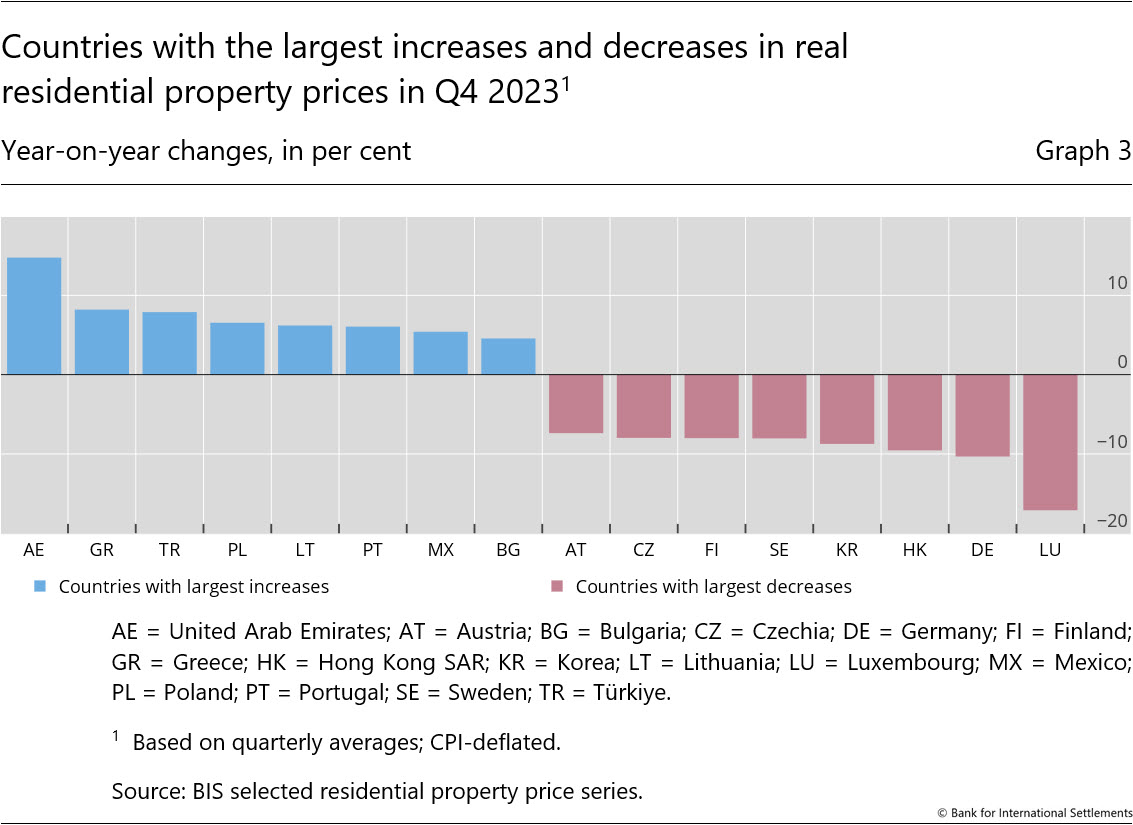
In contrast to the general picture, a significant number of countries continue to have buoyant housing markets. Real housing prices grew by at least 5% in four jurisdictions in EMEs and in three in AEs. Prices grew the most rapidly in the United Arab Emirates (+15%), Greece and Türkiye (both +8%) as well as in Poland (+7%).
Even with their recent drop, global real residential prices are still 5% above their levels observed before the onset of the Covid-19 pandemic. Compared with Q4 2019, they have increased by close to 140% in Türkiye, 22% in the United States, 13% in Australia and 12% in Japan. In contrast, real prices have experienced declines by 10% in India, 9% in South Africa, 7% in China and 6% in Brazil (Graph 4).
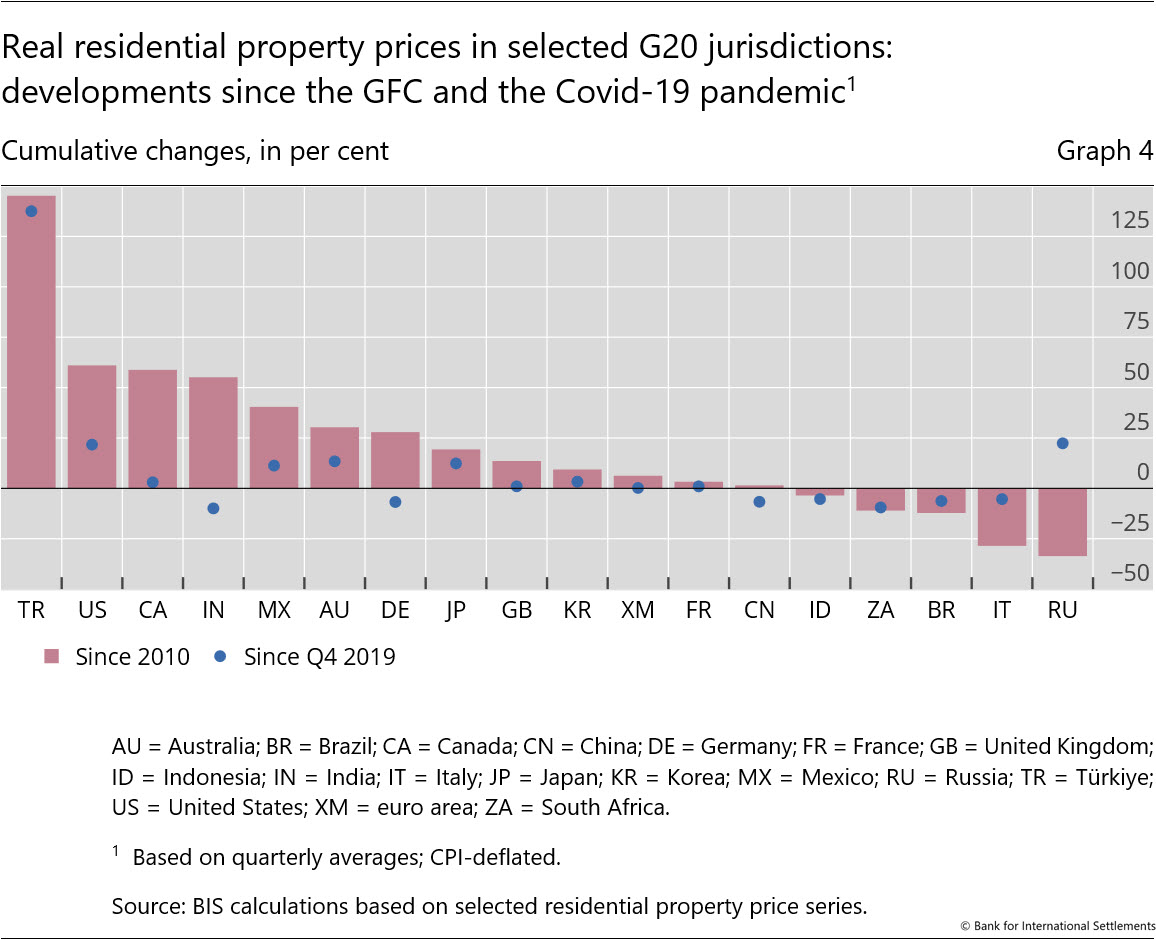
From a longer-term perspective, global house prices exceed (in real terms) their immediate post-GFC average by 23% (32% for AEs and 16% for EMEs) (Table 1). Among G20 economies, real prices have more than doubled since 2010 in Türkiye (up by 145%) and have risen by around 60% in Canada and the United States and by 55% in India. At the other end of the scale, they remain well below their post-GFC levels in Italy, by 29%.
Advanced economies
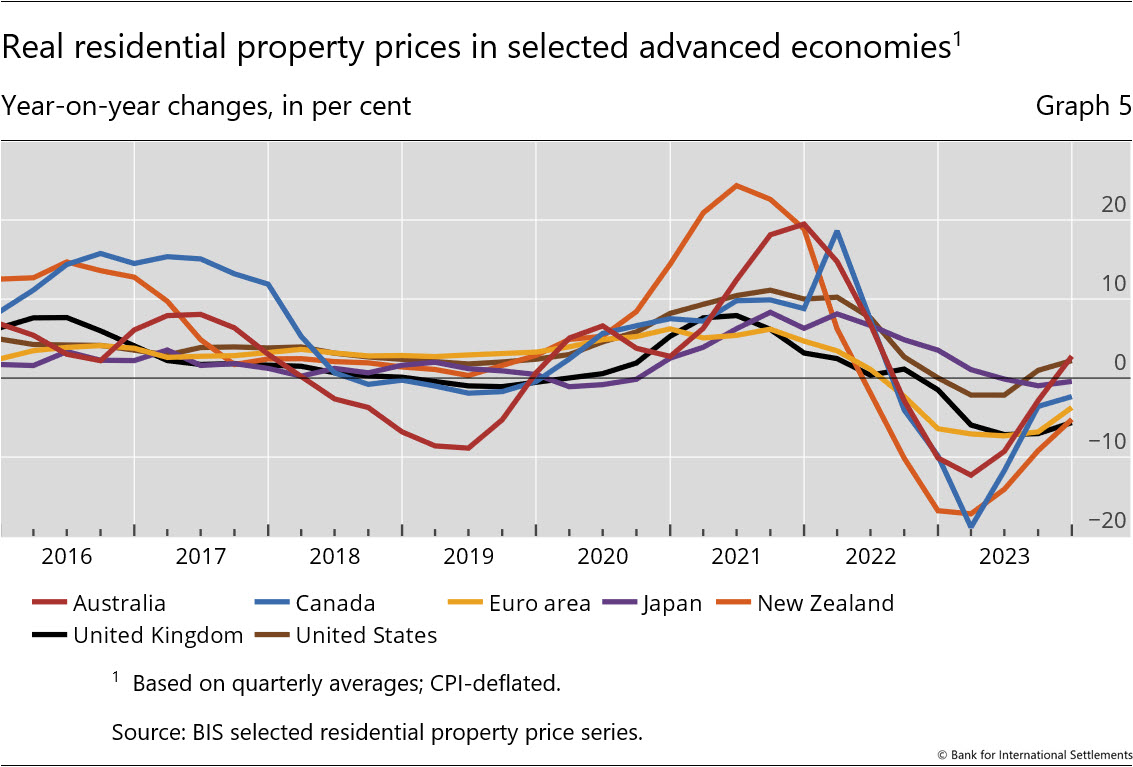
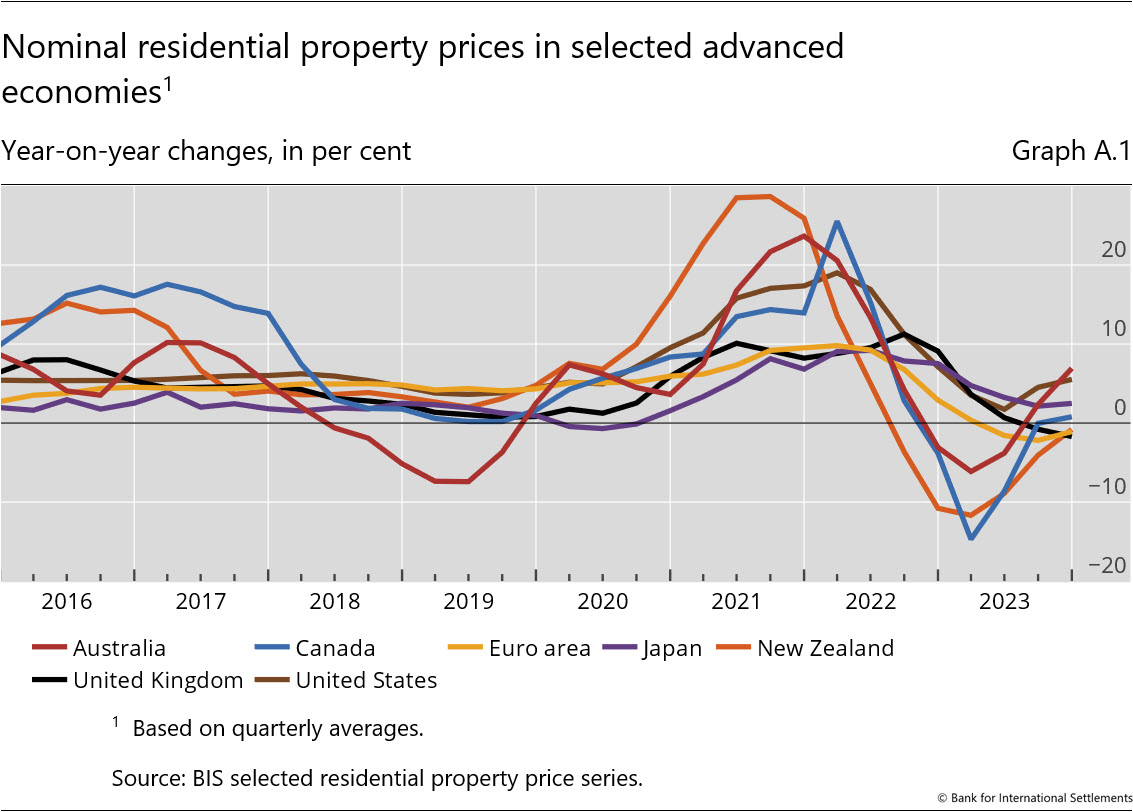
In aggregate for the group of AEs, real residential property prices declined by 0.8% yoy in Q4 2023, marking a significant moderation from the 2.8% fall observed in the previous quarter. Among major economies, real prices were up by 3% in Australia, 2% in the United States and were stable in Japan. They continued to fall, though less rapidly than in the recent past, in Canada (-2%), the euro area (-4%) and the United Kingdom (-6%) (Graph 5).
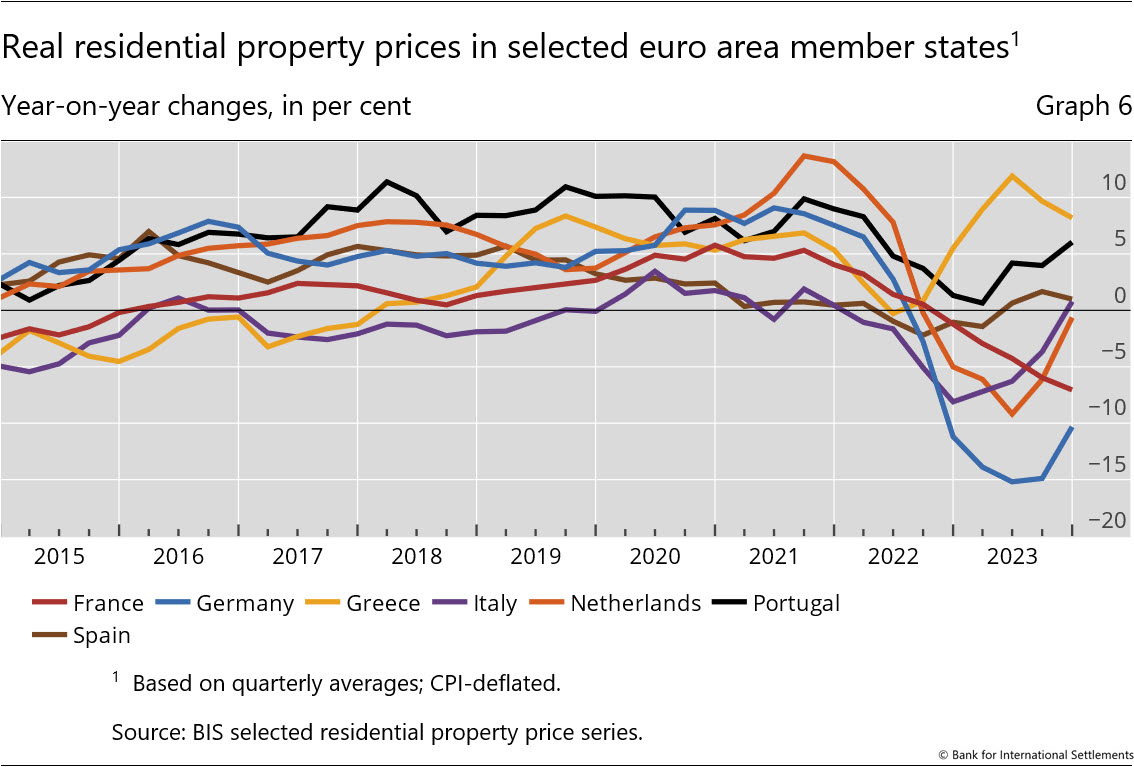
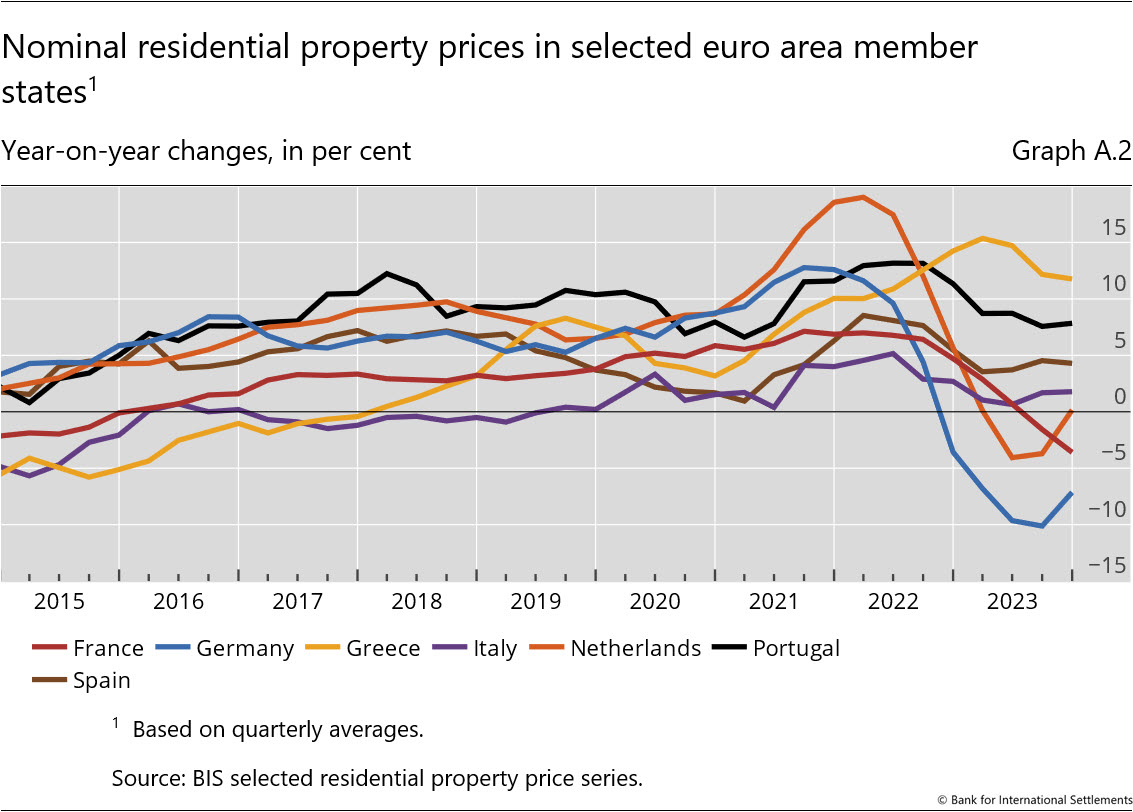
Within the euro area, real house prices continue to show significant variations among member states. They surged by 8% yoy in Greece and 6% in Portugal. They were broadly stable in Italy and Spain (both +1%) as well as in the Netherlands (-1%). In contrast, they declined by 7% in France and 10% in Germany (Graph 6).
Emerging market economies
Real residential property prices declined by 1.6% yoy in EMEs during the last quarter of 2023 (compared to -1.4% in Q3 2023), driven by the fall observed in aggregate in Asia; in contrast, prices increased moderately in all other regions.
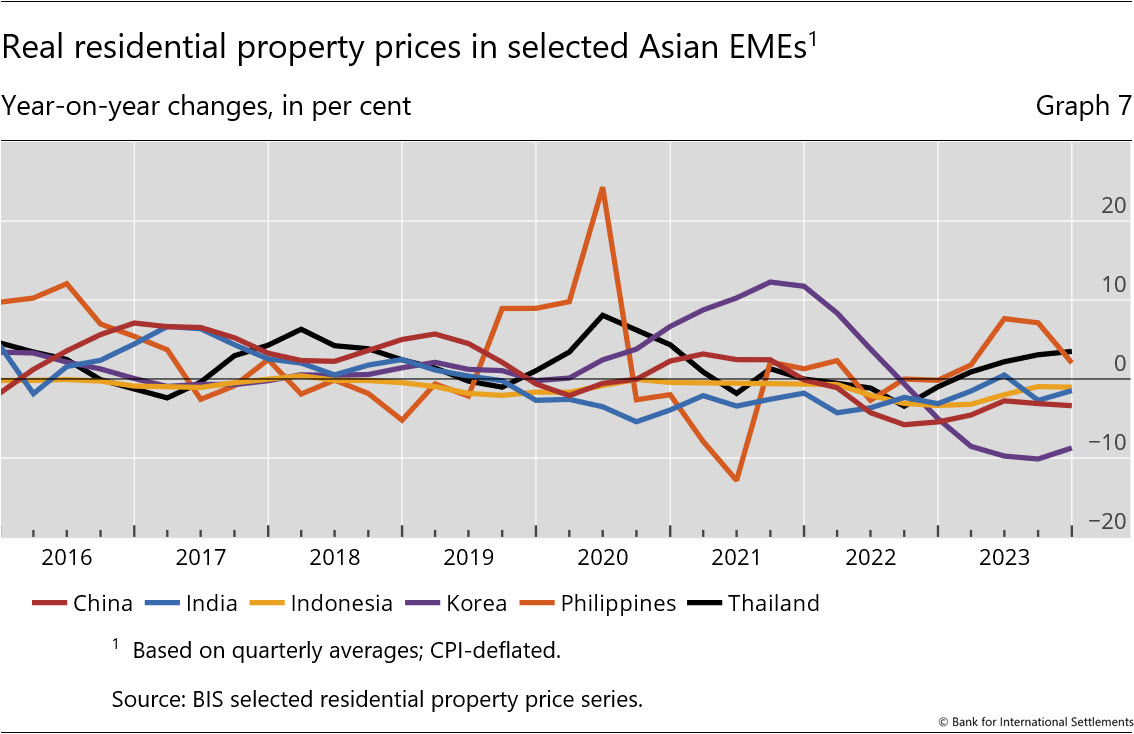
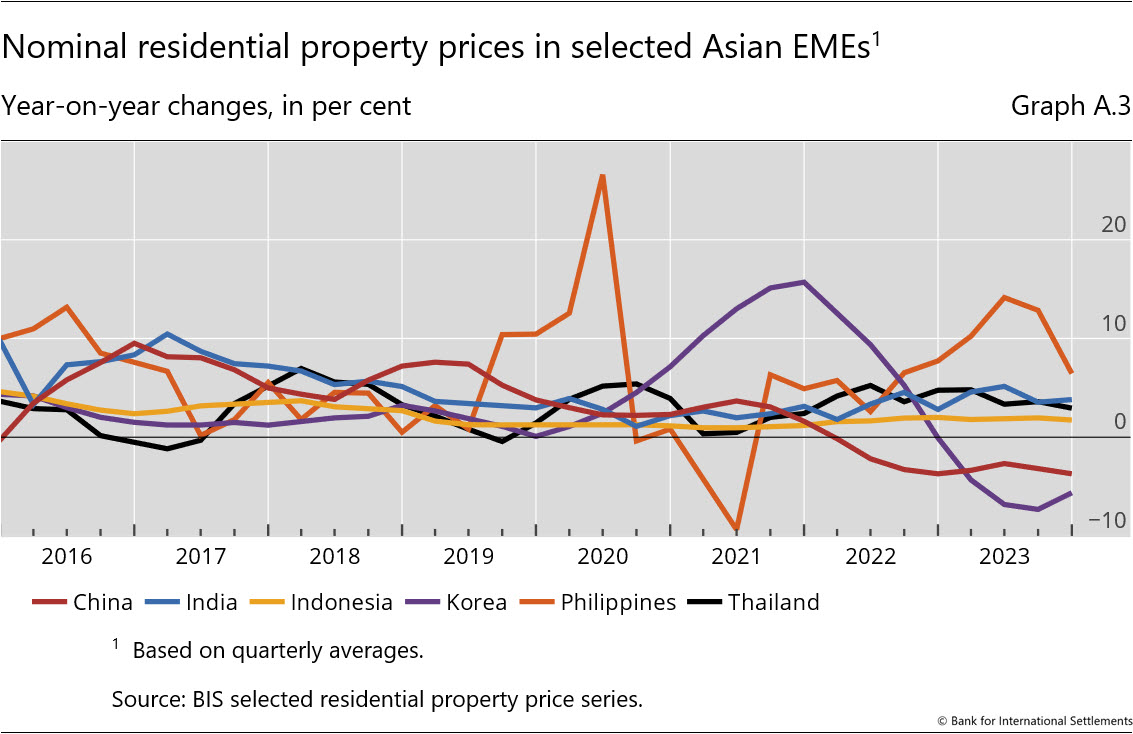
Prices fell by 2.7%, on average, in Asian economies. They increased by 3% in Thailand and 2% in the Philippines, while they remained nearly stable in India and Indonesia (with a slight decrease of 1% in both countries). In contrast, prices fell by 3% in China and, quite significantly, by 9% in Korea. (Graph 7).
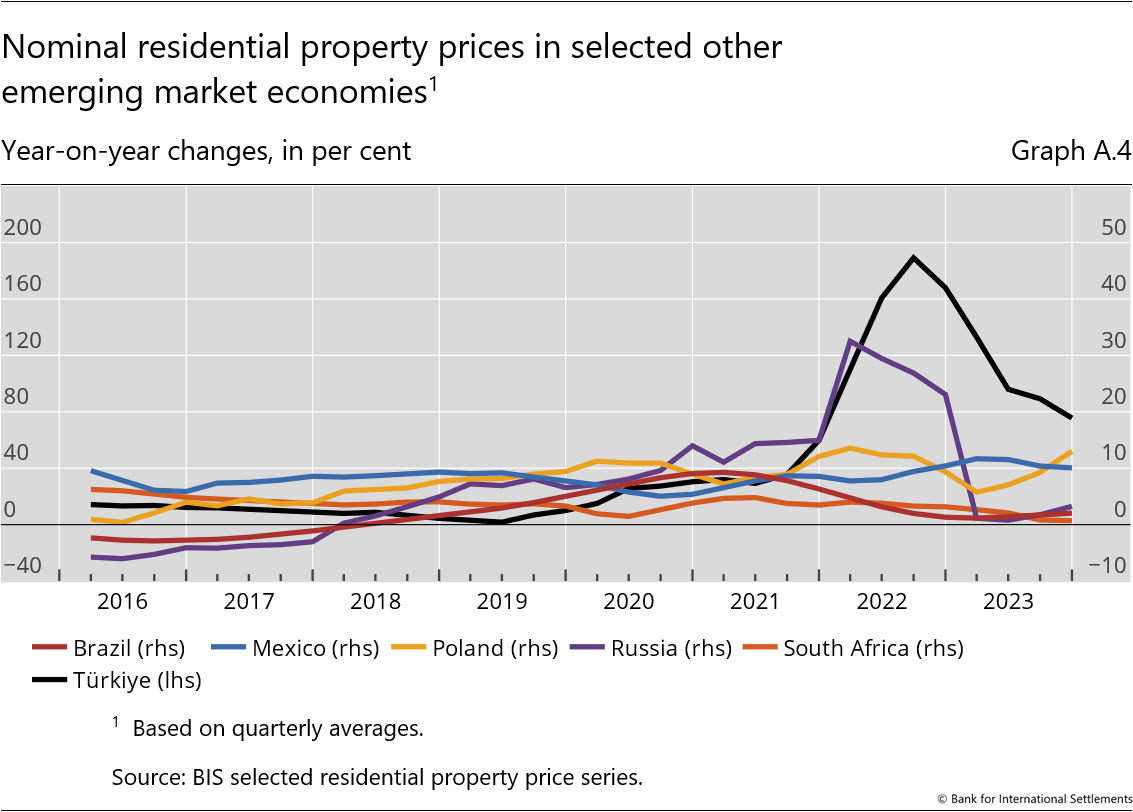
Real prices started to increase in Latin America (+1.0% in aggregate), mainly driven by a continued price increase in Mexico (+5%) only partly offset by a decline in Brazil (-3%). In central and eastern European countries, real prices grew by 1.3% in aggregate, driven by developments in Poland (+7%) and Türkiye (+8%). Regarding Türkiye, however, the yoy rate has moderated significantly, down from the surge of more than 50% observed in late 2022/early 2023. Lastly, prices fell by 5% in South Africa (Graph 8).
Annex: Nominal house price developments
1 Real residential property prices refer to nominal residential property price indicators deflated by the consumer price index. Global figures are weighted aggregates of selected AEs (Australia, Canada, Denmark, the euro area, Iceland, Japan, New Zealand, Norway, Sweden, Switzerland, the United Kingdom and the United States) and EMEs (Brazil, Bulgaria, Chile, China, Colombia, Czechia, Hong Kong SAR, Hungary, India, Indonesia, Israel, Korea, Malaysia, Mexico, Morocco, North Macedonia, Peru, the Philippines, Poland, Romania, Russia, Singapore, South Africa, Thailand, Türkiye and the United Arab Emirates), based on PPP exchange rates. Regional aggregates have been available since 2007.
2 The year-on-year growth in CPI moderated in 80% of the economies covered in the BIS data set between the third and fourth quarter of 2023. Residential property price developments in nominal terms are shown in the annex.
3 As regional aggregate developments are driven mainly by changes in major economies, they can mask the detailed country-level features presented in the histogram.