BIS residential property price statistics, Q2 2021

Key takeaways
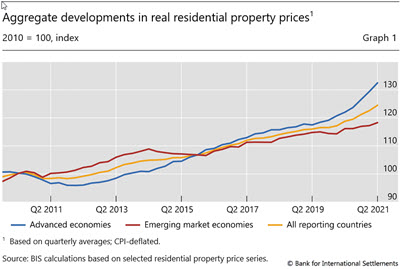
- Global house prices growth strengthened further in the second quarter of 2021 in real terms, to 4.8% year on year, their highest rate since the start of the Great Financial Crisis (GFC).1
- House price developments diverged further between advanced economies (where they accelerated further, to 8.6% year on year in Q2 2021) and emerging market economies (down to1.8%).
- In real terms, global house prices now exceed their immediate post-GFC average levels by 24.5%.
- The BIS property price statistics now include data for Argentina. As the second phase of the G20 Data Gaps Initiative nears its end-date at the end of 2021, residential property price indicators are available for 61 countries, including all G20 economies.
Summary of latest developments
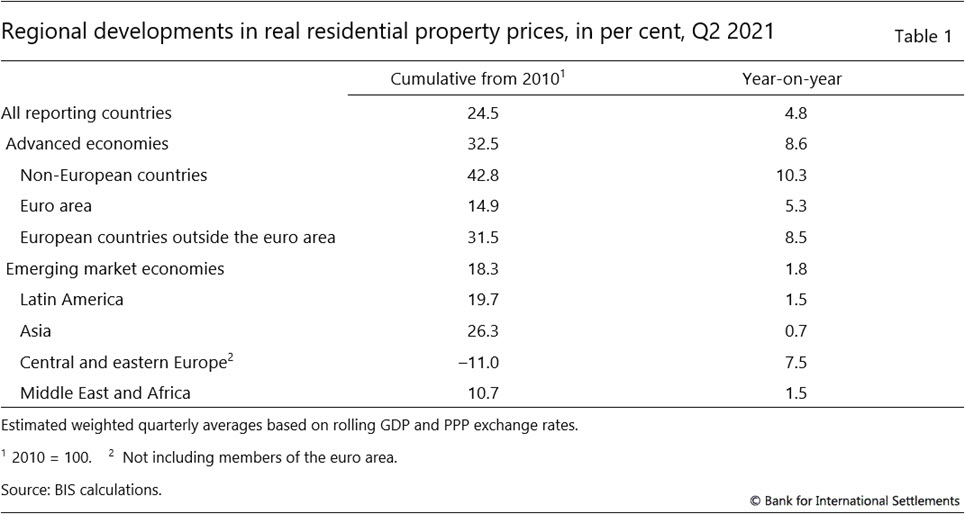
Global real house prices rose by 4.8% year on year in aggregate in the second quarter of 2021, their fastest growth rate since the 2007–09 Great Financial Crisis (GFC).2 Their growth was particularly strong in advanced economies (AEs), 8.6% on average, up from 7.2% in Q1 and 3.8% a year earlier. Real prices rose more moderately in emerging market economies (EMEs), by 1.8% on average, down from 2.6 % in Q1. There were, however, substantial differences across major EME regions: real house price growth surged by 7.5 % in central and eastern Europe, while it ranged between 0.7 % and 1.5 % in emerging Asia, Latin America and the Middle East and Africa.
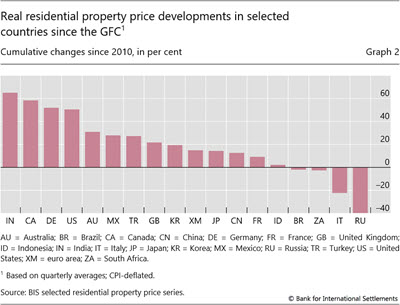
In real terms, global house prices now exceed their immediate post-GFC average by 24.5%, and by 32.5% and 18.2% for AEs and EMEs, respectively (Graph 1 and Table 1). Among the G20 economies, real prices have risen markedly since 2010 – by 50% to 65% – since 2010 in India, Canada, Germany and the United States. At the other end of the scale, they remain well below their post-GFC levels in Italy and Russia, by around 20% and 40%, respectively (Graph 2).
Advanced economies
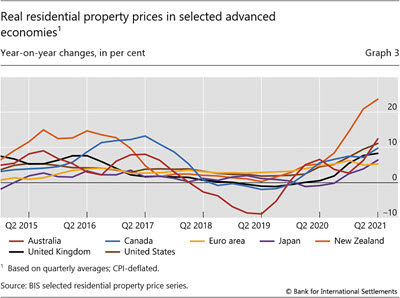
In aggregate for the group of AEs, real residential property prices soared by 8.6% year on year in Q2 2021, compared with 3.8% one year ago. Prices rose rapidly in Australia (+12%) the United States (+11%), Canada (+10%), the United Kingdom (+8%), and less so in Japan (+6%) (Graph 3). House prices continued to move upward at a double-digit rate in New Zealand (+24%).
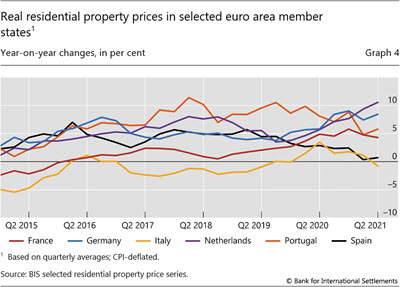
In the euro area, real year-on-year house price inflation was slightly more subdued (+5%), with significant variations among the member states. It remained strong in the Netherlands (+11%) and Germany (+8%), but less so in Portugal (+6%) and France (+4%); real prices remained almost stable in Spain (+1%) and Italy (–1%) (Graph 4).
Emerging market economies
In contrast with AEs, real residential property prices rose more moderately in EMEs during the second quarter of 2021, by 1.8% year on year, compared with 2.6% one quarter before.
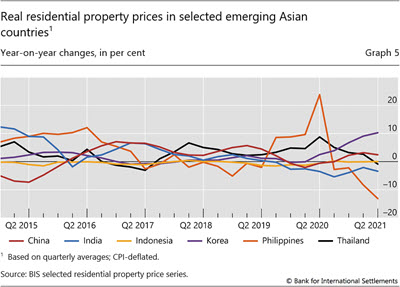
House price inflation remained subdued in emerging Asia (+0.7%), with significant variation across countries. Prices surged in Korea (+10%) and rose moderately in China (+2%), while they remained stable in Indonesia and kept falling in India (–3%) and the Philippines (–13%) (Graph 5).
Real house inflation was slightly stronger in Latin America in aggregate (+1.5% year on year), driven by moderate price growth in Brazil (+2%) and dynamic developments in Chile (+8%).
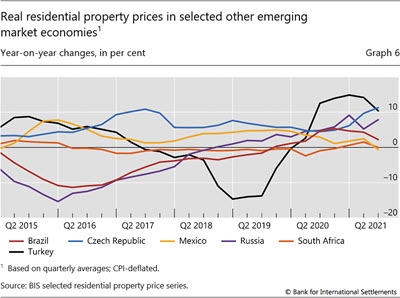
Turning to central and eastern Europe, real prices expanded by an average of 7.5% year on year, led in particular by their continued strength in Turkey (+10%) and Russia (+8%); house price inflation surged further in the Czech Republic (+11%) (Graph 6).
Closing data gaps: latest enhancements to the BIS property price statistics
As the second phase of the G20-endorsed Data Gaps Initiative (DGI II) nears its end-date at the end of 2021, significant progress has been made in closing the data gaps that were identified in global housing prices. In particular, residential property price indicators are now available for Argentina and have been added to the BIS dissemination exercise. The BIS database now includes time series for 61 countries including all G20 economies (Box A).
International cooperation to enhance statistical information on residential and commercial housing prices will continue after the completion of DGI II, especially among the international organisations member of the Inter-Agency Group on Economic and Financial Statistics (IAG), which comprises the BIS, the ECB, Eurostat, the IMF (Chair), the OECD, the United Nations and the World Bank, in close cooperation with the FSB.3
Regarding residential properties, international organisations will continue to liaise with national statistical agencies and central banks to publish more comparable data compiled in line with the Handbook on Residential Property Prices; these data will continue to be made available on the BIS website. A key objective is to publish quality-adjusted time series covering the whole country, all types of dwelling and all vintages. Countries are also invited to disseminate some regional data, especially covering the capital or largest cities.
Further work will also continue on commercial property prices which are also disseminated by the BIS on behalf of the IAG. So far, however, progress has been uneven: country coverage is still limited, including for the G20 economies, and time series are much less comparable across jurisdictions, despite international efforts to promote greater harmonisation.4
1 Real residential property prices refer to nominal residential property price indicators deflated by the consumer price index. Global aggregates are weighted aggregates of selected AEs (Australia, Canada, Denmark, the euro area, Iceland, Japan, New Zealand, Norway, Sweden, Switzerland, the United Kingdom and the United States) and EMEs (Brazil, Bulgaria, Chile, China, Colombia, Croatia, the Czech Republic, Hong Kong SAR, Hungary, India, Indonesia, Israel, Korea, Malaysia, Mexico, Morocco, North Macedonia, Peru, the Philippines, Poland, Romania, Russia, Singapore, South Africa, Thailand, Turkey and the United Arab Emirates), based on PPP exchange rates.
2 It is worth noting that the difference between nominal and real house price movements has widened recently. This was due to the upturn in consumer price inflation, from a very low base a year earlier in several countries, which has significantly offset the developments observed in nominal terms. India, for instance, was the only major economy where real house prices actually fell in Q2 2021 year on year, reflecting the combination of moderate nominal house price growth (+2%) and strong inflation (+5.6%).
3 The IAG was established at the time of the GFC to coordinate statistical issues, identify data gaps and strengthen data collection.
4 See BIS, Commercial property price indicators: sources, methods and issues, anInventory of commercial property price indicators.