Growth of the green bond market and greenhouse gas emissions

This article examines whether stricter public policies to curb greenhouse gas emissions have spurred the development of green bond markets and whether the issuance of green bonds has been associated with a subsequent reduction in emissions. The findings indicate that green bond markets have grown the most in countries with stricter emissions targets. Green bond issuance increased especially in sectors with heavy emissions that have been subject to sectoral mitigation policies. Moreover, even though green bonds lack binding constraints on emissions reduction, green bond issuance in those sectors has been followed by a significant reduction in emissions.1
JEL classification: F34, F36, G21, F23, F31, F36, G15.
Market capitalisation in the green bond market has reached $2.9 trillion, up nearly sixfold since 2018. Green bonds are intended to finance (a portion of) the investments needed to transition to sustainable economic development. These bonds, specifically earmarked to support initiatives to mitigate environmental impact, help channel funds into renewable energy, energy efficiency and other green projects.2 However, promoters of green bonds initially tolerated a variety of standards for impact reporting (Ehlers and Packer (2017)). As a result, at least up to 2018, issuance of green bonds carried little information about the level or trajectory of issuers' greenhouse gas (GHG) emissions (Ehlers et al (2020)).
The green bond market has since matured, growing fast by attracting a variety of issuers within and across jurisdictions (Cheng et al (2024)). This article provides an updated assessment of these developments and whether public policies to lower carbon emissions are echoed in green bond volumes.
The article first documents the rapid growth in the green bond market. It provides stylised facts about the size, structure and growth of the green bond market, against the backdrop of increasingly stringent environmental regulations and more transparent reporting of the impact of green bonds. Annual issuance reached $700 billion in 2024, a fraction of the estimated $2 trillion annual investment needed to tackle climate change (Ananthakrishnan et al (2023)).3 The rise of environmental, social and governance (ESG) investing in the asset management industry reflects the growing demand for sustainable instruments. Some investors, including those in the reserve management community, favour those green bonds where the environmental impact can be certified.4 On the supply side, green bond issuers have grown in number and now include a diverse group of sovereigns, municipalities, financial institutions and private corporations.
The article then empirically examines the relationship between climate abatement policies, green bond issuance and corporate GHG emissions. It does this by integrating firm-level data on emissions from S&P Trucost and issuance data from various financial databases.
Key takeaways
- The green bond market has grown exponentially since the 2015 Paris Agreement, with a diverse set of issuers that includes sovereigns, municipalities, financial institutions and private corporations.
- Increased issuance of green bonds has followed stricter emissions policies aimed at reducing country-level emissions.
- Issuing a green bond has become a good indicator of reduced corporate emissions, notably for firms in carbon-intensive sectors or those that had been heavy emitters.
In the second section, the article tackles two key empirical questions. The first is whether stricter regulatory frameworks have been effective in encouraging issuance of green bonds. The results suggest that regulatory stringency has a positive and statistically significant correlation with growth in the green bond market. In particular, policies that have targeted emissions in specific economic sectors have been followed by the largest increases in green bond issuance.
The second empirical question is whether the issuance of green bonds is followed by a future reduction in GHG emissions. Findings indicate that a firm's emissions decrease, and its carbon efficiency improves, following initial issuance of a green bond. This suggests that green bond financing strategies broadly defined, rather than the amounts associated with any specific green bond issue, can serve as a signal of firms' broader commitments to greening their operations. Further analysis reveals that this enhanced environmental performance is primarily achieved by firms in carbon-intensive sectors or those that were heavy emitters before issuing the green bond.
The final section concludes.
Green bonds, GHG emissions and environmental policies
The market for green bonds has evolved rapidly in recent years, alongside greater awareness of the economic costs of climate change. These bonds earmark proceeds for investment and other projects designed to mitigate the impact of economic activity on the environment, although generally without binding constraints (see Box A). This section presents stylised facts on the growth of green bond markets, the trajectory of GHG emissions and changes in climate-related public policies. Such policies have, until recently, incentivised emissions reduction primarily by corporations.
The market for green bonds
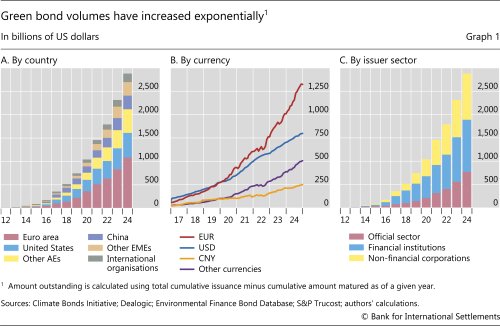
Since 2015 and the introduction of the International Capital Markets Association's Green Bond Principles (ICMA (2021)), the market for green bonds has ballooned. Amounts outstanding neared $3 trillion in 2024, up from roughly $500 billion as recently as 2018 (Graph 1.A).5 While this is still small relative to corporate bond markets more broadly, green bonds are no longer a niche market. This growth has been underpinned by greater regulatory support across many jurisdictions and increased investor demand for green assets, reflecting growing awareness of the financial risks associated with climate change.
The exponential growth in the market is the result of greater issuance of green bonds in multiple jurisdictions. Advanced economies (AEs) have taken the lead, with member states from the euro area and the United States combined accounting for about half of the outstanding amounts (Graph 1.A). China stands out among emerging market economies (EMEs) with a significant market share as well. This geographic origin of issuers is reflected in the currency of outstanding green bonds. Bonds denominated in euros and US dollars are the most prevalent, but those in renminbi are also gaining ground (Graph 1.B).
Issuers that are active in the green bond market include sovereigns, municipalities, financial institutions and non-financial corporations (Graph 1.C). Issuance by financial and non-financial corporations, especially in sectors with high emissions, has been particularly strong in recent years. The growing footprint of sovereign issuers has contributed to improvements in the quality and transparency of reporting standards. Because the use of proceeds type of green bond contradicts the principle of widespread fungibility of fiscal revenues, sovereign issuers of green bonds developed impact reporting and third-party certification (see Box A). Cheng et al (2024) show that non-sovereign issuers adopted these more stringent standards on green bonds as well.
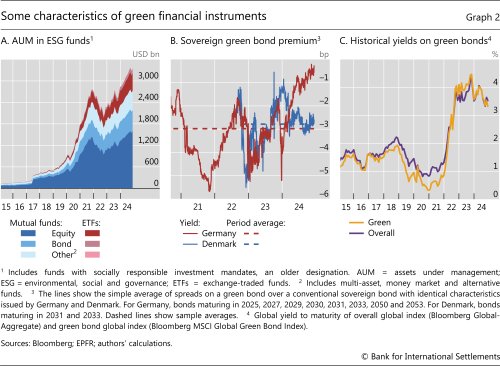
Both demand- and supply-side factors have spurred growth in the green bond market. On the demand side, investors have increasingly prioritised sustainable investments, or the appearance thereof, driven by a societal shift towards environmental consciousness. Institutional investors have placed greater importance on green bonds in their long-term investment horizon for a variety of reasons, including the broad eligibility and diversification benefits of these bonds. Some now have stricter ESG mandates, some want to hedge carbon risk, and others may simply want to appear "green" (Krahnen et al (2023); NGFS (2024)). Adding to this, some central banks have adopted sustainability as a fourth reserve management objective in addition to the traditional goals of safety, liquidity and return (see Fender et al (2019, 2020, 2022)). Green investment funds and sustainability-focused indices have emerged to meet this growing demand (Graph 2.A).
Notably, this strong demand may have conferred a cost benefit to issuers. The so-called "greenium" is a trading premium on green bonds over traditional (ie non-green) bonds with otherwise identical characteristics (Graphs 2.B and 2.C). Empirical evidence on the size of the greenium has been mixed. But it could be linked to demand pressures at issuance that reflect the investor preferences discussed above. External review and certification may also play a role (Caramichael and Rapp (2024)). Investors' preference for more environmentally responsible firms to support sustainable growth (preference channel) and their perception that more carbon-intensive firms have higher probability for default (risk channel) can both contribute to explaining the greenium6 (Xia and Zulaica (2022)). Flammer (2021) also documents that the issuance of green bonds triggers an increase in the equity price of the issuer, which could mean that green-oriented investors take it as a signal that the issuer will become more profitable, less risky or more attractive to other investors.
On the supply side, stricter environmental regulations and sustainability policies may have encouraged green financing, a point assessed below. The integration of ESG criteria into corporate strategies has prompted issuance, notably in the European Union (Caramichael and Rapp (2024)). More frequent issuance by sovereigns has also spurred development of green bond markets in their jurisdictions and raised green bond standards (Cheng et al (2024)). Finally, issuers seek the potential cost advantages (ie greenium) associated with green bonds.
Overall, the sixfold increase in market size since 2018 notwithstanding, green bonds are no panacea for funding the global energy transition. Issuers may be tempted to greenwash, improving their communication on sustainability without necessarily reducing their GHG emissions. The use of proceeds type of green bonds opens the door to such outcomes (Ehlers and Packer (2017); Scatigna et al (2021); Krahnen et al (2023)). In many jurisdictions, asset managers may also seek the label of green bonds exclusively for marketing purposes. In others, changes in the political arena may stigmatise green bonds and thus discourage asset managers from holding them.
GHG emissions of green bond issuers and mitigation policies
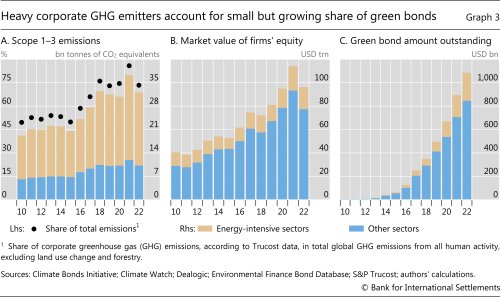
Which entities are responsible for the bulk of GHG emissions? And have they used green bonds to mitigate emissions? This section examines corporate GHG emissions and green bond issuance as a prelude to the empirical analysis that follows. Data from S&P Trucost track the scope 1, scope 2 and scope 3 GHG emissions of listed firms.7 Since the data for downstream scope 3 emissions are incomplete, those for upstream scope 3 emissions, together with scope 1 and scope 2 emissions, are used.
Overall, the entities captured in S&P Trucost data account for roughly two thirds of global GHG emissions (Graph 3.A).8 Among corporations, emissions are highly concentrated in a few sectors that account for a small share of market capitalisation but a high share of total emissions (Graphs 3.A and 3.B). This market capitalisation share for heavy emitters grew from 17% of outstanding green bonds in 2018 to 22% in 2022 (Graph 3.C).
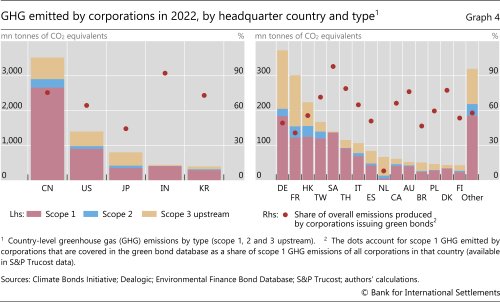
GHG emissions exhibit large geographical variation, reflecting diverse industrial activities and energy consumption patterns (Graph 4). Emissions are predominantly concentrated in a handful of countries with extensive manufacturing and energy-intensive sectors, such as China, the United States, Japan, India and Korea. By contrast, countries with more service-oriented economies generally exhibit lower emissions. For instance, Germany and Japan, with their substantial automotive and heavy manufacturing sectors, show higher emissions than their European and Asian counterparts. This variation highlights the role of national policies and energy endowments (eg the share of nuclear or hydraulic electricity generation) in shaping corporate environmental performance that is likely to also be reflected among green bond issuers.
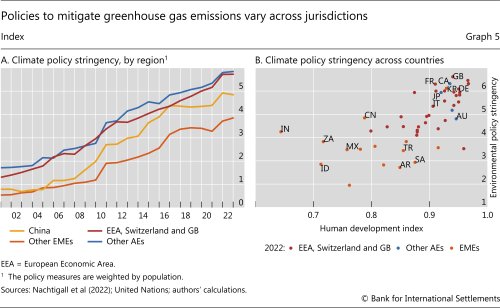
Since 2016, governments have generally tightened policies to mitigate GHG emissions, reflecting the growing urgency to address climate change (Graph 5.A). A major catalyst has been the Paris Agreement of December 2015, which prompted many jurisdictions to set more ambitious emissions reduction targets. These policy shifts have been complemented by enhanced reporting and transparency requirements for corporate emissions.
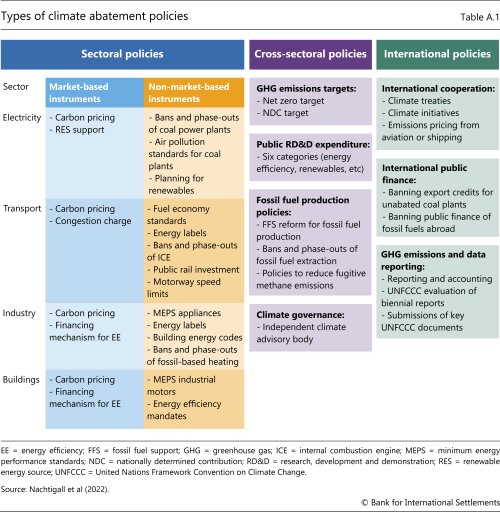
These mitigation policies differ by type and by how they incentivise GHG emissions reduction (see Table A.1 in Annex A). Sectoral policies target specific sources or economic sectors, such as electricity generation, transportation, agriculture and waste management. By contrast, cross-sectoral policies cut across multiple sources of emissions or sectors. For their part, international policies involve commitments associated with international agreements and cooperation, such as participation in key climate treaties, international climate initiatives, international public finance measures (eg banning export credits for unabated coal plants) and comprehensive GHG emissions data and reporting.
These general shifts towards more stringent environmental policies notwithstanding, considerable cross-country differences remain. Across all countries, those with a higher level of economic development, proxied here by the human development index, tend to have more stringent policies (Graph 5.B).
Does issuance of green bonds link climate change policies and GHG emissions?
This section explores two key empirical questions. First, are differences in the stringency of public policies to mitigate GHG emissions across countries reflected in differences in the development of national green bond markets? Second, do corporations reduce their GHG emissions after issuing green bonds?
Policy stringency and the rise of green bond markets
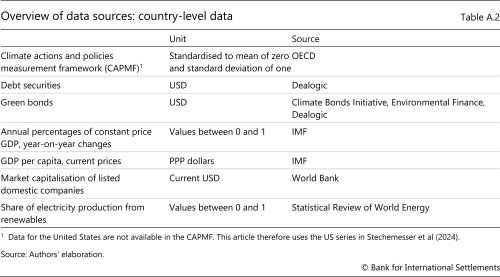
Stricter climate policies may incentivise firms to green their operations and thus spur growth in green bond markets. This section investigates this formally using regressions on a sample of 39 countries from 2011 to 2022 (see Annex A).
The baseline empirical specification relates the size of countries' green bond markets to policy stringency. The size of countries' green bond markets is proxied by either total annual issuance (log-transformed) or the share of green bonds in total bond issuance.9 The core explanatory variables include lagged standardised policy stringency indicators for the various policies described above. Other explanatory variables, such as GDP growth, GDP per capita, debt market size, market capitalisation and the share of renewable energy in electricity use, are also included as controls. Finally, country fixed effects are included to account for time-invariant differences across countries, and year fixed effects are included to capture time-specific shocks common to all countries.
Further reading
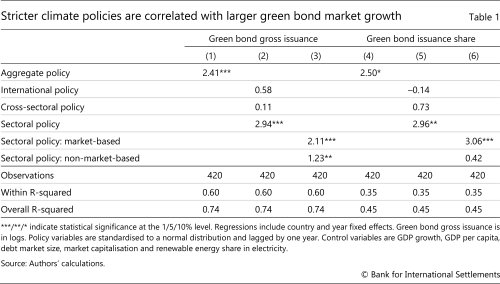
The results show a positive correlation between policy stringency and the size of countries' green bond markets (Table 1). An increase in the aggregate policy stringency by one standard deviation is associated with around 2.4% higher annual issuance of green bonds (column 1). Not all types of policies have the same impact, however. Sectoral policies, ie those that apply to specific industrial sectors, appear to have a louder echo in green bond issuance (columns 2 and 3): a one standard deviation shift towards greater stringency is associated with nearly 3% more green bond issuance. This result remains consistent in alternative specifications, where the size of the green bond market is proxied by its share in total bond issuance (columns 4 to 6).
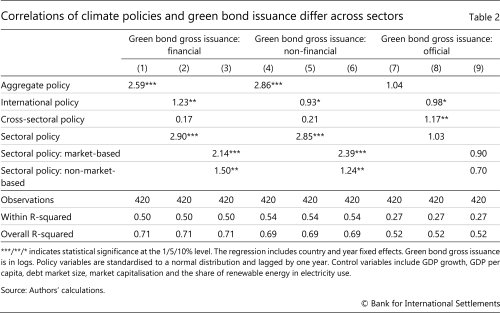
The design features of green bonds can vary across sectors, affecting the relationship between green bond issuance and policy stringency. Table 2 thus repeats the above regressions using issuance amounts in the financial sector (columns 1 to 3), non-financial sector (columns 4 to 6) and official sector (columns 7 to 9), respectively. For all three sectors, international policies such as participation in key international climate initiatives appear to coincide with greater issuance of green bonds. However, the story is different for cross-sectoral and sectoral policies. Cross-sectoral policies significantly correlate with green bond issuance only for the official sector, while sectoral policies significantly relate to issuance only for the financial and non-financial sectors.
One possible reason for these sectoral differences is that cross-sectoral policies involve actions implemented at the regional or national level. Examples include setting GHG emissions targets (eg nationally determined contributions, a key element of the Paris Agreement) or public research and development expenditures. Regional or national policies may prompt the official sector to issue green bonds to finance related projects. By contrast, sectoral policies tend to target specific sectors such as electricity, industry, transport and construction, making them more relevant for corporate issuance.
Green bond issuance and GHG emissions
The second important question is whether green bond issuance is also correlated with firms' actual GHG emissions. On this question, the results in the literature to date have been mixed (Ehlers et al (2020); Flammer (2020, 2021); Fatica and Panzica (2021)), potentially due to different data sources. With the surge in green bond issuance and improvements in emissions reporting in recent years, this section revisits this question using a data sample with more than double the outstanding amount of green bonds available previously.10 This sample complements that in Cortina et al (2025), who focus on non-financial corporations and consider green bonds and green syndicated loans together.11
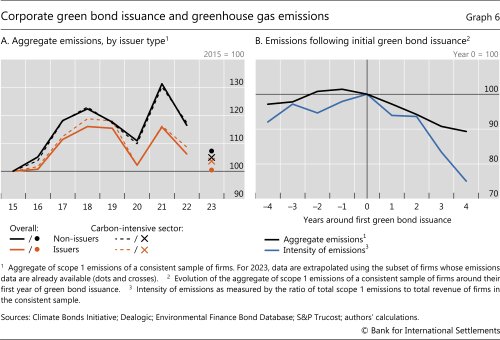
As a prelude to the regression analysis, Graph 6 presents a high-level view of how green bond issuance interacts with firms' GHG emissions. Between 2016 and 2022, firm-level GHG emissions experienced humped-shaped growth regardless of whether the firm issued green bonds (Graph 6.A), reflecting at least in part the reduction of activity due to Covid-related lockdowns in 2020 and 2021. However, for firms that did issue green bonds, their increase in emissions between 2015 and 2019 was noticeably milder. This is evident in both the overall firm sample (solid lines) as well as in the subsample of carbon-intensive firms (dashed lines).
Green bond issuance also appears to be associated with a downward trajectory in firms' emissions (Graph 6.B). This can be seen in the drop in GHG emissions starting in the year of an initial issuance. In aggregate terms, the emissions of green bond issuers fell by more than 10% in the four years following issuance (black line). The profile of the carbon efficiency of these firms' operations suggests that this reflects changes in business practices beyond those stemming from pandemic-related lockdowns. Specifically, emissions per unit of firm revenue – a measure of emissions intensity (blue line) – shows an even starker drop following a green bond issuance. This metric dropped by nearly 30%, a faster pace than the one observed across the entire population of listed firms over the last decade (Jondeau et al (2021)).
Of course, green bond issuance alone may not explain these emissions trajectories. The green bond amounts seem to be small relative to the size of issuer firms (Flammer (2021)), and the impact they may have on the issuers' overall business model may be limited (Lam and Wurgler (2024)). In addition to any direct impact of climate-friendly projects financed by green bonds, the drop in emissions may also stem from firms' broader commitments to reduce emissions and green their operations. Green bonds may thus merely be a signal of such broader initiatives.
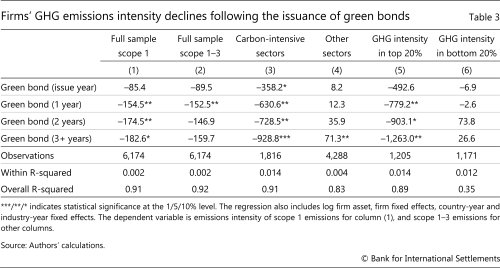
Table 3 shows via regression analysis whether, as shown in Graph 6, issuers of green bonds reduce their GHG emissions.12 The dependent variable is the GHG emissions intensity of a firm based on either scope 1 emissions or scope 1–3 emissions.13 To capture the intertemporal impact of green bond issuance, each regression includes dummy variables that indicate the year a firm issued its first green bond, one year after the first issuance, two years after the first issuance and three or more years after. In addition, the regression includes firm-level fixed effects and a combination of industry-year and country-year fixed effects to control for time-varying factors (eg the effect of Covid-19 lockdowns) (see Annex A, Table A.3).
The results show that green bond issuance is associated with a significant reduction in firms' subsequent GHG emissions.14 For scope 1 emissions (Table 3, column 1), firms' emissions intensity decreased by around 21%15 on average one year after the firm first issued a green bond. Similar results emerge with the broader emissions metric (column 2, scope 1–3 emissions). Emissions intensity remains significantly lower for direct emissions even after three years. These results are qualitatively consistent with those in previous studies based on narrower data samples.16
Finally, Table 3 also reveals that it is the heavy emitters that reduce their GHG emissions after issuing green bonds. Given the skewness of carbon emissions, this is critical in terms of societal "net zero" objectives. While firms in the carbon-intensive sectors achieve significantly lower emissions intensity, firms in other sectors do not (columns 3 and 4). Splitting the sample by emissions intensity before a firm's first green bond issuance shows consistent results (columns 5 and 6): firms in the highest emissions intensity quintile group reduce their emissions significantly, while those in the lowest intensity quintile group do not. Taken together, the results suggest that green bond issuance appears to signal deliberate changes in GHG emissions from sectors and by players that are the most relevant for aggregate GHG trajectories.
Conclusion
The rapid growth of the green bond market since the 2015 Paris Agreement highlights the increasing importance of green financial products in addressing climate change. The issuance of green bonds has proven to be a significant mechanism for channelling capital towards environmentally sustainable projects. The market now attracts a diverse array of issuers, including sovereigns, municipalities, financial institutions and, particularly, private corporations.
The empirical analysis presented above shows that green bond issuance has expanded the most in jurisdictions that have adopted stricter decarbonisation policies. Moreover, issuance has been followed by a fall in carbon emissions at the firm level.
These results combined indicate that green bonds have emerged as a reliable signal of firms' overall commitment to improve environmental performance, at least in terms of GHG emissions. This seems to be the case particularly for heavy carbon emitters. By bridging the gap between environmental goals and financial markets, green bonds appear to contribute, perhaps only modestly considering their scale, to the global strategy to combat climate change.
Looking forward, issuers and promoters of green bonds should consider whether explicit binding constraints on GHG emissions at the issuer level could attract more demand for green bonds and thereby lower the funding costs of investments in more sustainable economic activities.
References
Ananthakrishnan, P, T Ehlers, C Gardes-Landolfini and F Natalucci (2023): "Emerging economies need much more private financing for climate transition", IMF Blog, 2 October.
Bank for International Settlements (BIS) (2019): "BIS launches green bond fund for central banks", press release, 26 September.
Caramichael, J and A Rapp (2024): "The green corporate bond issuance premium", Journal of Banking & Finance, vol 162, no 107126.
Cheng, G, T Ehlers, F Packer and Y Xiao (2024): "Sovereign green bonds: a catalyst for sustainable debt market development?", BIS Working Papers, no 1198, July.
Cortina, J, C Raddatz, S Schmukler and T Williams (2025): "Green debt transition: from issuances to emissions", presentation at the HKIMR-ECB-BOFIT Joint Conference, Hong Kong SAR, 14–15 January.
Ehlers, T, B Mojon and F Packer (2020): "Green bonds and carbon emissions: exploring the case for a rating system at the firm level", BIS Quarterly Review, September, pp 31–47.
Ehlers, T and F Packer (2017): "Green bond finance and certification", BIS Quarterly Review, September, pp 89–104.
Fatica, S and R Panzica (2021): "Green bonds as a tool against climate change?", Business Strategy and the Environment, vol 30, no 5, pp 2688–701.
Fender, I, M McMorrow, V Sahakyan and O Zulaica (2019): "Green bonds: the reserve management perspective", BIS Quarterly Review, September, pp 49–63.
----- (2020): "Reserve management and sustainability: the case for green bonds?", BIS Working Papers, no 849, March.
Fender, I, M McMorrow and O Zulaica (2022): "Sustainable management of central banks' foreign exchange reserves", Grantham Institute, Policy Briefing Papers, no 6, July.
Flammer, C (2020): "Green bonds: effectiveness and implications for public policy", Environmental and Energy Policy and the Economy, vol 1, no 1, pp 95–128.
----- (2021): "Corporate green bonds", Journal of Financial Economics, vol 142, no 2, pp 499–516.
Guesmi, K, P Makrychoriti and E Pyrgiotakis (2025): "Climate change exposure and green bonds issuance", Journal of International Money and Finance, vol 152, no 103281.
International Capital Markets Association (ICMA) (2021): Green bond principles: voluntary process guidelines for issuing green bonds, June.
Jondeau, E, B Mojon and L Pereira da Silva (2021): "Building benchmark portfolios with decreasing carbon footprints", BIS Working Papers, no 985, December.
Krahnen, J, J Rocholl and M Thum (2023): "A primer on green finance: from wishful thinking to marginal impact", Review of Economics, vol 74, no 1, pp 1–19.
Lam, P and J Wurgler (2024): "Green bonds: new label, same projects", National Bureau of Economic Research Working Papers, no w32960, September.
Nachtigall, D, L Lutz, M Cárdenas Rodríguez, I Haščič and R Pizarro (2022): "The climate actions and policies measurement framework: a structured and harmonised climate policy database to monitor countries' mitigation action", OECD Environment Working Papers, no 203, November.
Network for Greening the Financial System (NGFS) (2024): Sustainable and responsible investment in central banks' portfolio management: practices and recommendations, May.
Scatigna, M, D Xia, A Zabai and O Zulaica (2021): "Achievements and challenges in ESG markets", BIS Quarterly Review, December, pp 83–97.
Stechemesser, A, N Koch, E Mark, E Dilger, P Klösel, L Menicacci, D Nachtigall, F Pretis, N Ritter, M Schwarz, H Vossen and A Wenzel (2024): "Climate policies that achieved major emission reductions: global evidence from two decades", Science, vol 385, no 6711, pp 884–92.
United Nations Development Programme (UNDP) (2024): Human development report 2023–24: breaking the gridlock: reimagining cooperation in a polarized world, March.
Xia, D and O Zulaica (2022): "The term structure of carbon premia", BIS Working Papers, no 1045, October.
Annex A
Countries covered in the empirical analysis
Argentina, Australia, Austria, Belgium, Canada, Chile, China, Colombia, Czechia, France, Germany, Greece, Hungary, India, Indonesia, Ireland, Israel, Italy, Japan, Korea, Luxembourg, Malta, Mexico, the Netherlands, New Zealand, Norway, Peru, Poland, Portugal, Romania, Russia, Saudi Arabia, Slovenia, South Africa, Spain, Switzerland, Türkiye, the United Kingdom and the United States.
Climate mitigation policies
The Climate Actions and Policies Measurement Framework (CAPMF) is a database developed under the International Programme for Action on Climate to track and evaluate climate mitigation policies across 52 countries from 2000 to 2022. The CAPMF measures the adoption and stringency of market-based instruments (eg carbon taxes, emissions trading schemes), non-market-based instruments (eg standards, bans) and other climate actions (eg emissions targets, climate governance). It includes 128 policy variables grouped into 56 policy instruments and other climate actions, covering sectoral, cross-sectoral and international policies. The measure for the US used in the econometric analysis is based on Stechemesser et al (2024), which rely on a similar methodology.
1 We thank Torsten Ehlers, Ingo Fender, Gaston Gelos, Corrinne Ho, Mike McMorrow Frank Packer, Andreas Schrimpf, Hyun Song Shin, Frank Smets, Dora Xia, Evertjan Veenendaal and Nertila Xhelili for their helpful comments, and Jimmy Shek for excellent research assistance. The views expressed are those of the authors and do not necessarily reflect those of the Bank for International Settlements.
2 Cheng et al (2024) note that sustainable bond markets consist of two types of bonds. The funds raised through "use of proceeds" bonds are earmarked for climate and environmental projects in the case of green bonds; projects related to health and education, affordable housing or food security for social bonds; and a mixture of green and social projects in the case of sustainability bonds. A second type is "outcome-based" bonds where the coupon payment increases if contractually specified sustainability performance targets are not met.
3 Of course, green bonds are just one of many tools available to help corporations green their operations.
4 The BIS's own green bond funds, for example, were developed in part to support the adoption of best practices, including impact reporting, in the green bond market (BIS (2019)).
5 There are currently no binding international reporting standards for green bonds (see Box A). The data on green bonds are compiled from issuance data from three different vendors. A bond is classified as green if at least one vendor identifies it as such. This yields a comprehensive sample of 11,874 green bond issues in total by 3,352 different issuers from 2015–24.
6 The magnitude of the greenium differs across the term structure of bonds (Xia and Zulaica (2022)) and appears to be largest for bonds of large, investment-grade issuers (Caramichael and Rapp (2024)).
7 The standards were developed as part of the Greenhouse Gas (GHG) Protocol, which provides guidelines for entities to quantify and report their direct and indirect emissions. Scope 1 covers direct emissions from owned or controlled sources, while scope 2 covers indirect emissions from electricity, heating, cooling etc consumed by the reporting entity. Scope 3 emissions refer to emissions by other entities in an entities' value chain, either upstream or downstream. Corporate issuers can influence their scope 3 emissions only indirectly, through the choice of their providers or customers.
8 The data are compiled from corporate annual reports and other disclosures. Additionally, the provider employs models recommended by the GHG Protocol to estimate the emissions impact of disclosed activities and investments, filling in any gaps in the data. The global emissions not covered by Trucost are mostly due to consumption (eg transport or housing) and to agriculture.
9 The total bond issuance of a country is the aggregate of all issues recorded in the Dealogic database.
10 The papers mentioned above rely on data available through 2018 or 2019.
11 The data used here are sourced from different databases than those used by Cortina et al (2025).
12 The regression analysis is based on a panel data set of 736 green bond issuers (991 green bond issues) during the sample period of 2011–22.
13 Scope 1–3 is the sum of scope 1, scope 2 and scope 3 upstream emissions. Scope 3 downstream emissions are not included because of measurement issues and incomplete data. The results based on scope 1–2 emissions alone are consistent with those using scope 1–3.
14 These results are consistent with Cortina et al (2025) but differ from those of Guesmi et al (2025), whose estimates are based on a much smaller sample of green bonds compared with the sample in this article. Guesmi et al (2025) find that firms with high exposure to climate risks issue more green bonds.
15 Given the average scope 1 emissions intensity before initial green bond issuance in the sample is about 739.8 tonnes of CO2 equivalents per $1 million of revenue.
16 For example, Flammer (2021) finds improved environmental performance after the issuance of green bonds to be more significant when the bonds are certified by independent third parties. Fatica and Panzica (2021) find a similar effect when green bonds issued for refinancing purposes are excluded. Finally, Cortina et al (2025) find that green debt issuance tends to be followed by improvements in CO2 efficiency among non-financial firms.

