The global drivers of private credit

Private credit has grown rapidly over the past two decades and expanded into more and more industries. Cross-country evidence shows that the footprint of private credit is larger in countries with lower policy rates, more stringent banking regulation and a less efficient banking sector. Examining the cost of capital of business development companies (BDCs), an important private credit investment vehicle, reveals that banks' initial funding advantage has substantially narrowed since 2010. The convergence in the cost of capital reflects a fall in BDCs' cost of equity relative to that of banks and a rise in BDCs' leverage. Private credit's growth has therefore been bolstered, at least in part, by a relative improvement in its funding cost. 1
JEL classification: G20, G23, G28.
Private credit funds have increased their assets under management (AUM) from about $0.2 billion in the early 2000s to over $2,500 billion today. As private credit's footprint in the financial system develops, interest is growing among regulators and in public policy circles in understanding its drivers and attendant financial stability implications.
This article explores global patterns in the growth of private credit and contributes to the literature by systematically studying its underlying drivers with detailed loan-level data. Moreover, it examines how changes in the cost of capital may have supported the growth of private credit vis-à-vis banks.
Three findings emerge from our analysis.
First, while private credit has grown rapidly and serves an increasing variety of industries, the loan portfolios of individual funds remain heavily concentrated. Portfolio specialisation in narrow industries can yield benefits through lenders' superior screening and monitoring capabilities – improving credit access for riskier and more opaque firms. However, a lack of diversification could expose funds to sector-specific downturns, which requires investors – up to now mostly institutional – to diversify their portfolios of private credit assets. The trade-off between specialisation and diversification is bound to gain prominence as AUM continue to grow and fund managers seek avenues for greater participation by retail investors, who may be less aware of the concentration risks involved.
Key takeaways
- Private credit has grown rapidly and broadly over the past two decades, while individual funds' loan portfolios remain concentrated in a handful of industries.
- The footprint of private credit is larger in countries with lower policy rates, less efficient banking systems and, to some extent, more stringent banking regulation.
- A fall in the cost of equity and a rise in the leverage of business development companies (BDCs), an important private credit investment vehicle, have narrowed the gap between the cost of capital for banks and BDCs. This suggests that the growth in private credit partly stems from declining funding costs.
Second, the footprint of private credit is larger in countries with lower policy rates, less efficient banking systems and, to some extent, more stringent banking regulation. In a panel covering private credit loans for 45 countries between 2010 and 2019, all three variables have a statistically significant impact on loan originations by private credit funds. In terms of economic magnitude, the efficiency of the local banking system has the largest impact, followed by the level of the policy rate.
Third, the gap between the cost of capital of banks and business development companies (BDCs), an important private credit investment vehicle, has narrowed substantially since 2010. The spread between the cost of capital of publicly listed BDCs and that of banks has declined by around 200 basis points (bp) between the Great Financial Crisis (GFC) and 2019. The narrowing of the spread reflects a relative increase in banks' cost of equity in the aftermath of the GFC as well as a steady increase in BDC leverage. These patterns suggest that at least part of the rise of private credit has been supported by a relative improvement in its cost of funding.
The rest of the article is structured as follows. The first section provides a brief introduction to the features of private credit markets. The second examines global trends in private credit and its underlying country-specific drivers. Section three compares the cost of capital of BDCs with that of banks. The final section discusses the implications of our findings for the relationship between banks and private credit funds and the nature of financial intermediation going forward.
A primer on private credit
Private credit generally refers to non-bank credit extended by specialised investment vehicles ("funds") to small or medium-sized non-financial firms.2 Deals are usually directly negotiated between borrowers and lenders, and the originator holds the loan on their balance sheet until maturity.
Most funds operate as closed-end structures that lock in capital for their life cycle, which typically ranges from five to eight years. They do not trade on exchanges and are not available to retail investors, which makes them illiquid and subject to lighter regulation. The life cycle of funds usually matches the average maturity of their loan portfolios, which mitigates liquidity and maturity transformation risks.
Some fund structures, however, offer investors more frequent redemption windows. An important example is BDCs in the United States, many of which list their shares on stock exchanges and are accessible to retail investors.3 They are subject to federal regulation and have disclosure requirements similar to those of mutual funds, providing transparency and investor protection. With over $300 billion in AUM, BDCs represent 20% of the private credit market in the United States today.4 Attempts to bring retail investors into the fold have been a general trend in the private credit space. To this end, fund managers are increasingly experimenting with structures that allow investors to regularly redeem a portion of their funds (eg "evergreen funds" or "interval funds").
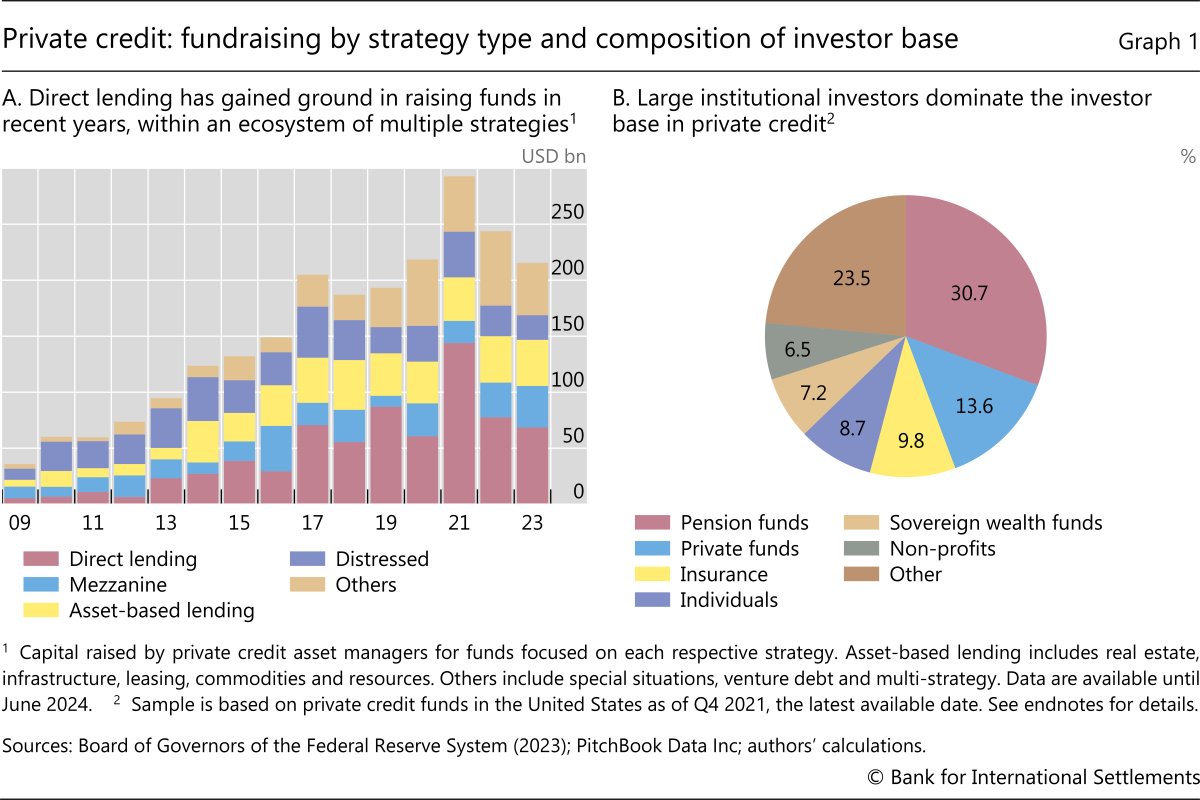
On the asset side, funds usually specialise in certain strategies. Direct lending, which refers to funds extending covenant-heavy floating rate loans, has been the dominant strategy over the past decade (Graph 1.A, red bars). It relies on cash generation from firms' regular operations ("cash flow lending") instead of collateral. BDCs mostly engage in direct lending. Mezzanine lending is another common strategy, which consists of extending junior or subordinated debt to larger companies, often with equity participation rights (blue bars). These instruments bridge the gap between debt and equity. Asset-based lending (yellow bars) in turn requires hard assets as collateral, such as real estate, infrastructure or aircraft. The category "distressed" (purple bars) refers to funds that purchase troubled fixed income assets – such as non-performing loans – in the secondary markets at a significant discount to their intrinsic or fundamental value. To date, total AUM of private credit funds exceed $2.5 trillion globally. In the United States, they exceed total outstanding leveraged loans or high-yield bonds (IMF (2024)).
The main sources of capital for private credit funds are institutional investors with long-term investment horizons and low liquidity needs. They include public and private pension funds, insurance companies and sovereign wealth funds (Graph 1.B). Insurance companies in particular have increased their asset allocations towards private credit.5 Institutional investors primarily value seemingly attractive returns on their locked-up investments.6 Retail investors make up a small but growing share.
Firms borrowing from private credit funds value flexible loan terms and are often underserved by banks. Surveys suggest that smaller and highly leveraged firms with scarce tangible collateral appreciate that deals are better tailored to their needs (Block et al (2024)). Compared with bank loans, firms also value the bespoke covenant structures and faster execution, as well as funds' readiness to renegotiate loan terms if needed. Reflecting these benefits, firms with negative earnings before interest, taxes, depreciation and amortisation (EBITDA), higher debt, lower accounting transparency and low tangible collateral value are more likely to borrow from private credit funds (Chernenko et al (2022), Jang (2024)).
Global patterns and drivers
This section first discusses global patterns in the development of private credit. It then systematically examines in a regression framework the drivers underlying its rise.
Aggregate patterns and concentration risks
To study global patterns in private credit, we rely on data from PitchBook Data Inc. The loan-level data provide information on direct and asset-based loans by private credit funds, including loan amounts, rate spreads, maturity, and borrower location and industry.
Private credit has seen spectacular growth in many jurisdictions. Global total outstanding loan volumes have increased from around $100 billion in 2010 to over $1.2 trillion today. The lion's share of credit is originated in the United States – over 87% of the total today, an increase from $90 billion in 2010 to over $1 trillion in 2024 (Graph 2.A, black line). Europe (excluding the United Kingdom) accounts for about 6% of the total in recent years (red bars) and the United Kingdom (blue bars) for about 3–4%. Canada accounts for most of the remainder.7
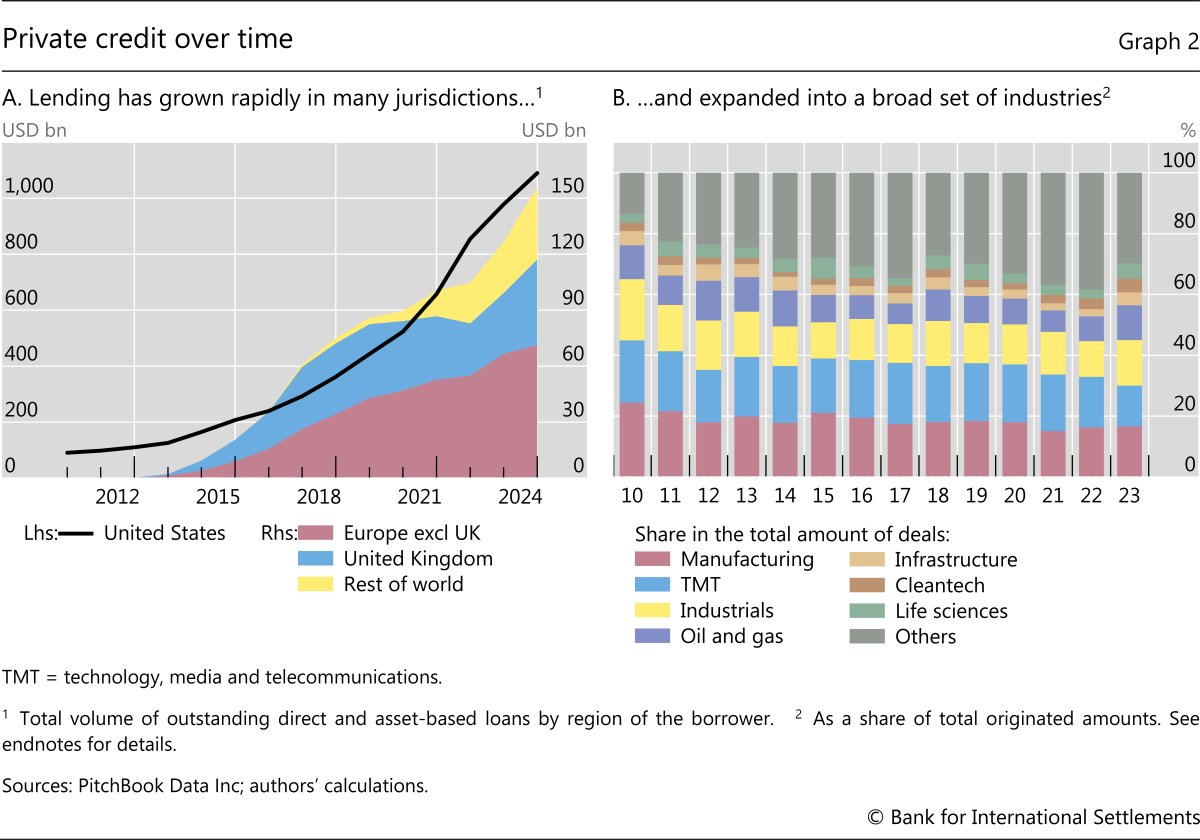
Private credit funds serve an increasingly wide variety of industries. Manufacturing, technology, media and telecommunications, and industrials used to account for over two thirds of all deals (Graph 2.B). Their share has shrunk to less than 40% today. Other industries, including cleantech and life sciences, make up an increasing share of the total.
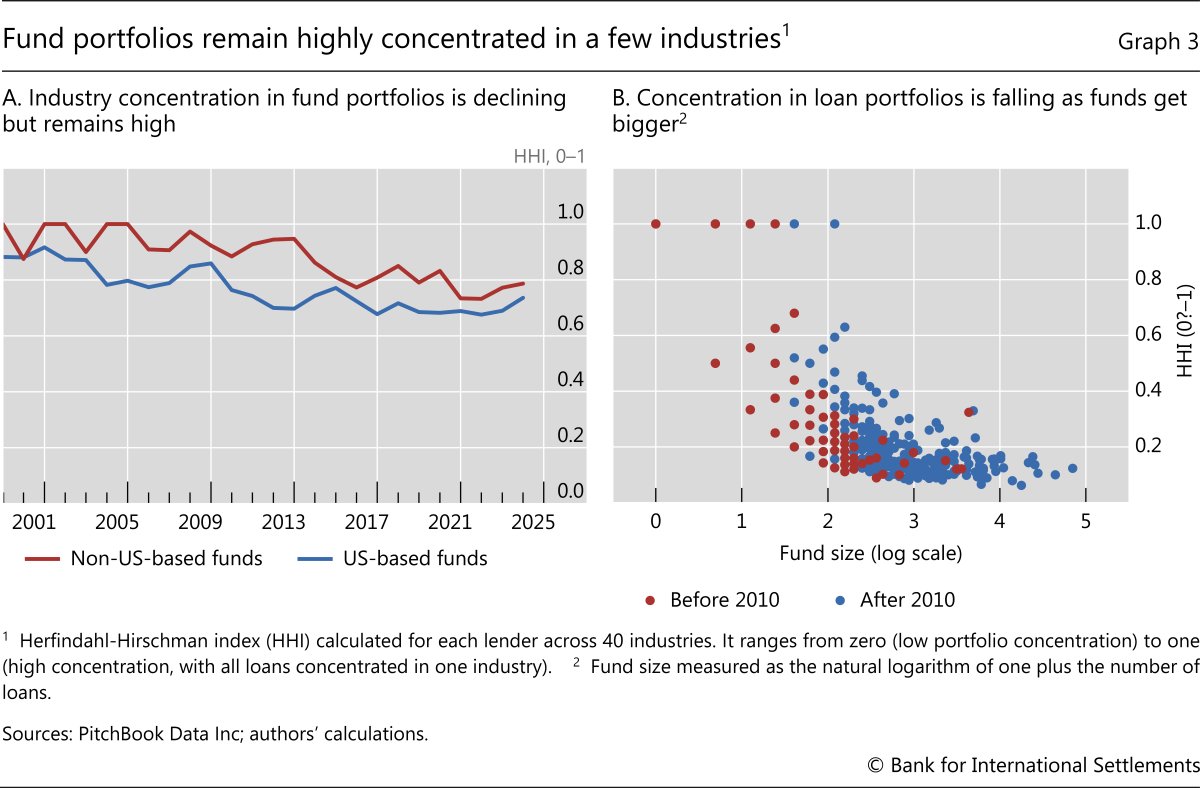
While the scale and scope of private credit has increased overall, loan originations by individual funds remain heavily concentrated in just a few industries (Graph 3.A). The Herfindahl-Hirschman index (HHI), a common metric of portfolio concentration that ranges from zero (low concentration) to one (high concentration), averages 0.74 and 0.81 for funds based in the United States and elsewhere (blue and red lines), respectively. This compares with banks' and non-banks' HHI in the syndicated loan market of 0.2 and 0.4, respectively (Aldasoro et al (2022)). Concentration ratios have fallen as average fund size rose. For a given fund size, portfolio concentration was similar before and after 2010 (Graph 3.B, red vs blue dots). However, fund size has increased markedly over time, and larger funds are more diversified in general.
Portfolio concentration yields benefits but also entails risks. Specialisation in narrow markets provides a deeper understanding of borrower characteristics and improves lenders' ability to monitor and manage loans. Specialised lenders can hence offer more favourable loan terms, such as larger loans, lower risk-adjusted interest rates and longer maturities, and they are more willing to lend to smaller, opaque firms within their area of expertise. At the same time, greater diversification reduces exposure to region- or industry-specific shocks, mitigating credit risks.8
Should the share of retail investors rise, private credit funds may need to reassess the merits of specialisation. The purported advantages of funds relative to banks – superior screening and monitoring as well as bespoke loan terms – require some specialisation. But specialisation leaves funds exposed to idiosyncratic risks. As asset managers explore options to attract retail investors, who might have a limited understanding of the risks involved, funds may need to opt for greater portfolio diversification. Indeed, that may even become a regulatory requirement in some jurisdictions. But greater diversification could erode their competitive advantage of local expertise.
Drivers
We now study the factors underlying the rising footprint of private credit globally. Motivated by the literature, we examine four hypotheses.
The first hypothesis is that lower interest rates have contributed to the rise of private credit. They could have done this in several ways. For one, a low-for-long period might have induced institutional investors to search for yield and steer their portfolios towards private credit funds, lowering their funding costs. For another, a steady decline in policy rates could have eroded bank profitability. Low nominal interest rates mean a narrower spread between assets and liabilities because deposit rates adjust slowly to market rates (Drechsler et al (2017), Sarto and Wang (2023)). Bank profitability thus falls as policy rates trend downward, depressing banks' net worth and curtailing loan supply (Abadi et al (2023)). Private credit funds, which are wholesale financed at market rates and extend floating rate loans, face no such spread compression. Thus, they could have gained market share at the expense of banks during the low rate period.
The second hypothesis is that private credit fills unmet demand for credit in general. About 10% of all small and medium-sized firms in advanced economies (AEs) and over 20% in emerging market economies (EMEs) report being credit constrained, often due to a lack of collateral (Caballero et al (2025)). The growth of direct lending by private credit, providing uncollateralised loans with tailored covenants to small and medium-sized firms, could stem from the needs of firms underserved banks.
Further reading
Third, stricter regulation for banks has spurred lending by private credit funds. Post-crisis banking regulation likely reduced banks' willingness to lend to risky firms.9 Faced with an increase in the cost of bank credit, riskier firms may turn to non-bank lenders, including BDCs (Chernenko et al (2022), Davydiuk et al (2024)).
And fourth, rising leverage among non-financial corporations (NFCs) could have enlarged the footprint of private credit. Private credit funds are more willing to lend to highly leveraged borrowers. The substantial increase in NFC leverage in many countries over recent decades could therefore have coincided with increased lending by private credit funds.
To test these hypotheses, we assemble a quarterly data set on private credit loans for 45 countries between 2010 and 2019. By jointly considering different drivers in a cross-country regression setting, our work expands on existing studies that have predominately focused on individual countries, most notably the United States, or non-bank financial institutions more generally. We estimate the following regression:

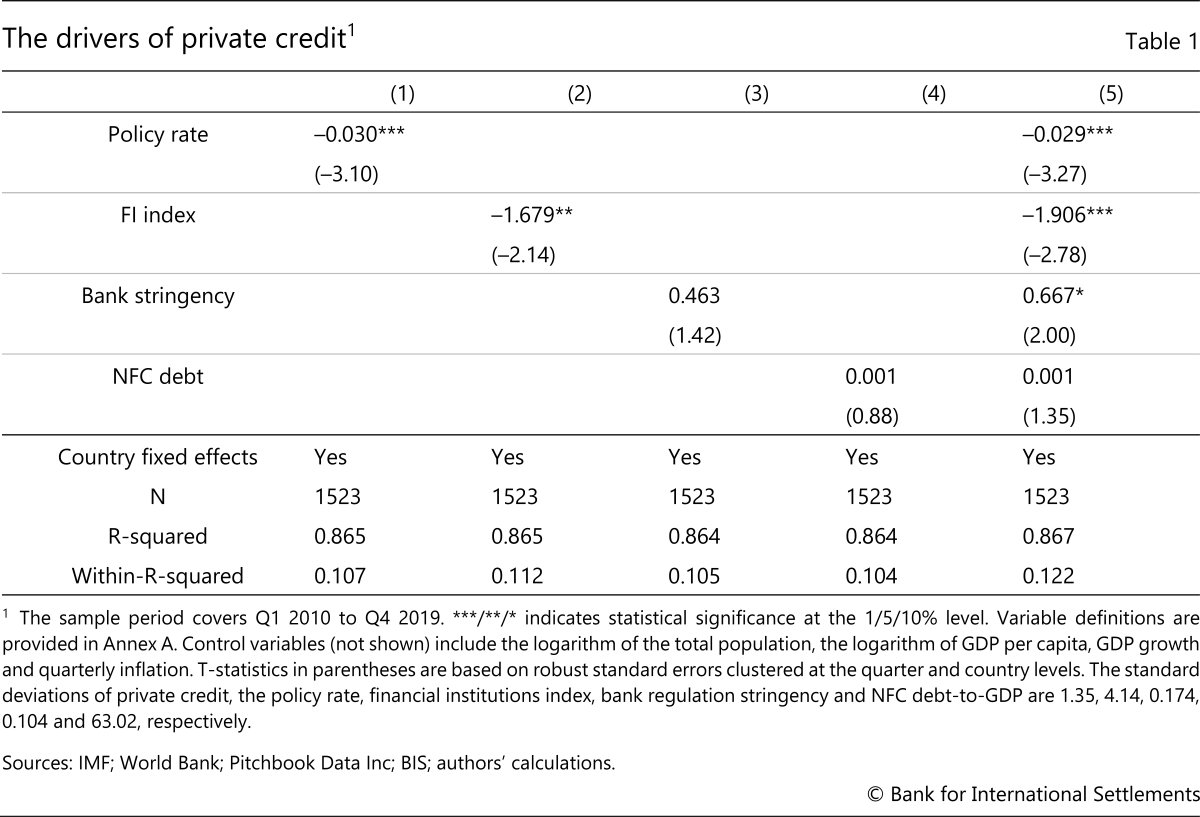
The dependent variable PCc,t is the natural logarithm of the total amount of newly originated private credit (PC) loans in country c and quarter t. The set of explanatory variables Xc,t captures variables related to the four hypotheses laid out above. These include the policy rate; the International Monetary Fund's financial institutions (FI) index, which proxies banks' general ability to satisfy loan demand; the stringency of bank regulation; and NFC leverage. Annex A provides more details on data sources and variable definitions. The regressions include country fixed effects, θc, capturing time-invariant country-specific factors (eg country size and institutional features) as well as measures for economic development and business cycles.
Table 1 shows that originations of direct loans are higher when policy rates are lower, when the financial institutions index is lower – ie when banks are less capable to serve loan demand – and when the levels of bank regulatory stringency and total NFC leverage are higher.10 These findings are consistent with the hypotheses laid out above. In terms of economic significance, a one standard deviation decrease in the policy rate (4.14%) is associated with an increase in private credit of about 12%. The average decline in policy rates observed between 2007 and 2017 in the median country in our sample is about 4 percentage points, which implies a significant impact on private credit. Similarly, a one standard deviation decrease in the FI index of 0.17 points is associated with an increase in private credit activity of about 33%. To put this into perspective, a difference of 0.17 points corresponds to roughly half the difference between AEs and EMEs in our sample.11 The smallest effects are attributable to bank regulation stringency and NFC leverage, where a one standard deviation increase is associated with an increase in private credit activity of around 7%.
The rise of private credit is due to shifting demand and supply factors over different periods, with demand factors being more influential before the GFC and supply factors driving growth from 2010 onwards. To disentangle demand and supply factors, we apply statistical methods to the average interest rate on private credit deals over the policy rate and the total number of private credit deals in the United States (Box A). A historical decomposition suggests that demand factors were the dominant driver before the GFC, when private credit experienced modest growth in general. Demand factors might have dominated in that period due to a growing number of riskier firms or firms with few tangible assets that were underserved by traditional banks. Funds' credit supply, however, emerges as the more important driver from 2010 onwards, when private credit grew particularly strongly. Supply factors could be attributable to a decline in funding costs for private credit funds, possibly spurred by low policy rates. This finding is consistent with our hypothesis that the low-for-long period contributed to the rise of private credit.
Banks, private credit and the cost of capital
To better understand how private credit funds compete with banks, we examine their cost of capital. A lower cost of capital allows lenders to offer loans at lower rates, thereby attracting more borrowers and expanding their market share.
The cost of capital comprises two primary components, the cost of equity (CoE) and the cost of debt (CoD). The CoE is the return shareholders expect for their investment in a company. It is often computed as an application of the capital asset pricing model by adding to the risk-free rate a risk premium that compensates the investor for the firm's exposure to market risk. The CoD is the effective interest rate a company pays on its borrowed funds, which include bonds, lines of credit or deposits, among others. The overall cost of capital, known as the weighted average cost of capital (WACC), combines these two components based on their respective proportions in the company's capital structure. We obtain information on the WACC, CoE and CoD from Bloomberg.12
To study the cost of capital, we focus on banks and BDCs in the United States. Detailed data on the funding of private credit funds are scarce. BDCs, as listed companies and major players in the private credit space, provide in their regulatory filings the information necessary to compute the costs of equity, debt and capital. In generalising our findings, however, it is important to keep in mind that BDCs differ from other debt funds in important ways.13
Banks' CoE was broadly similar to that of BDCs up until 2009 but has been higher since then (Graph 4.A, red line). It increased by substantially more than that of BDCs (blue line) during the GFC, likely reflecting the higher stock market variability of banks due to concerns about their health. Following the GFC, except for a brief period during the Covid-19 pandemic, a sizeable gap persisted, in part reflecting the generally much higher leverage of banks.14
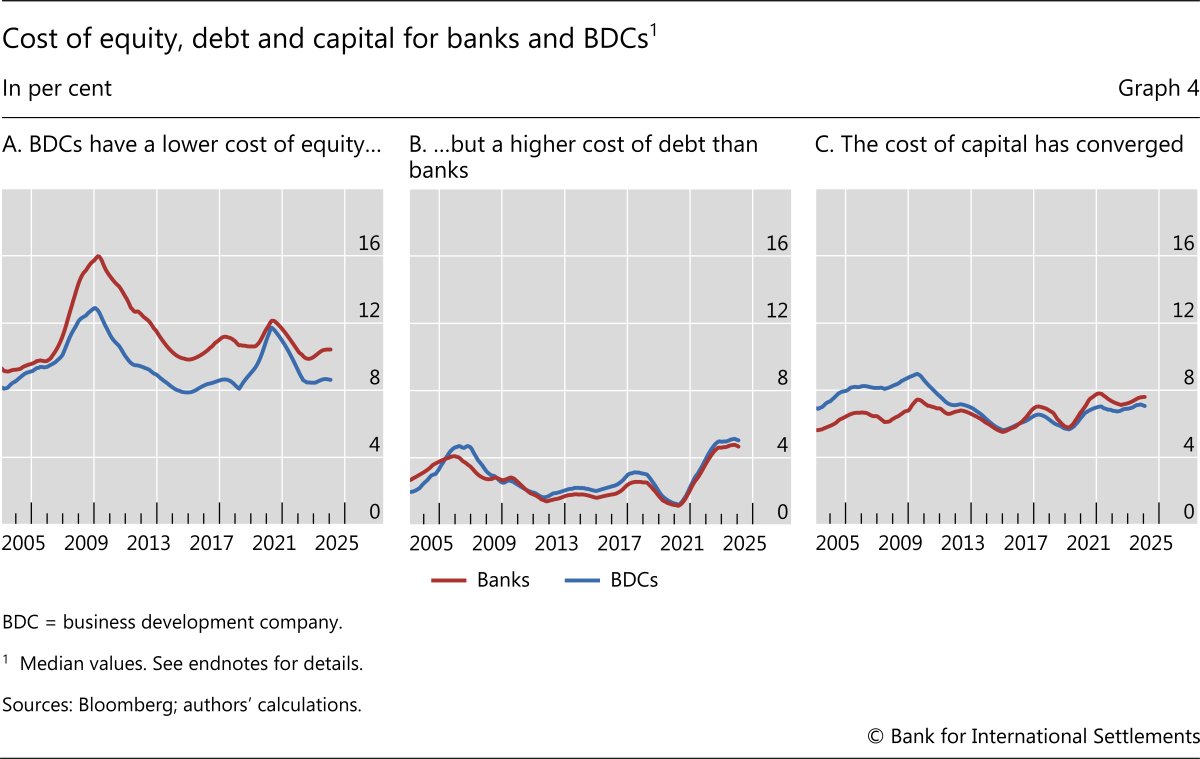
BDCs' CoD has been slightly higher than that of banks, and more so during periods of monetary tightening (Graph 4.B). During the three hiking cycles by the Federal Reserve starting in mid-2004, early 2016 and early 2022, BDCs' CoD increased by somewhat more than that of banks. These patterns reflect that BDCs are mostly wholesale financed at rates that move closely with the policy rate. Bank debt also comprises deposits with "sticky" rates that increase by less than the policy rate, implying an attenuated increase in funding costs when interest rates rise.15
Combining both series, we find that BDCs' cost of capital was relatively higher than that of banks in the pre-GFC period but that the series have converged since then (Graph 4.C). The WACC of BDCs (blue line) was around 200 bp higher than that of banks (red line) before the GFC, suggesting that banks enjoyed a material funding advantage at the time. Between 2010 and 2019, the spread declined by about 250 bp, with a pronounced drop during the GFC and in its immediate aftermath.16
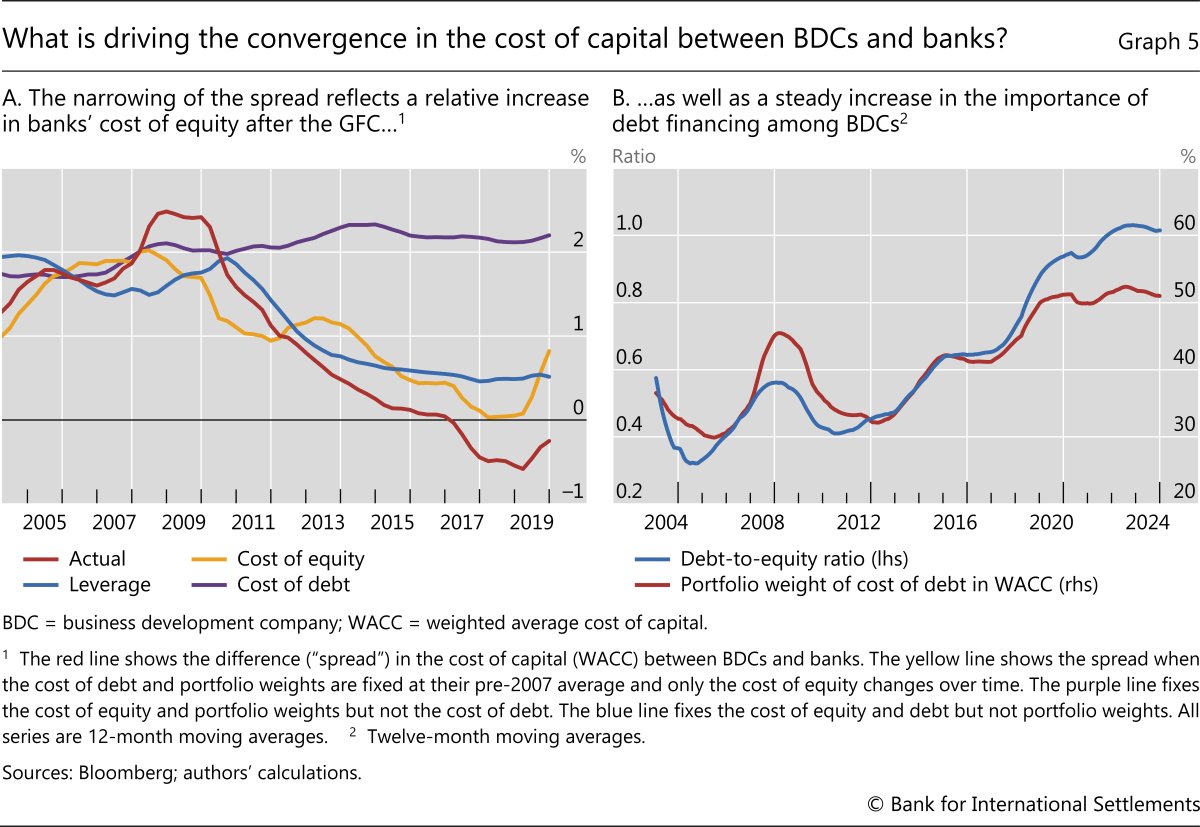
Further analysis indicates that the narrowing of the spread between the cost of capital of banks and BDCs is largely explained by a fall in BDCs' cost of equity and a material increase in their leverage. To establish this, we compute three counterfactual time series of the spread between the WACC of banks and that of BDCs. First, we allow only the cost of debt of banks and BDCs to vary over time, while holding their cost of equity and capital structure, ie the shares of debt and equity in total capital, constant at their respective pre-2007 averages. Second, we vary only the cost of equity but fix the cost of debt and the capital structure. Third, we allow only the capital structure to vary while keeping the cost of equity and debt fixed. The three series illustrate the relative contributions of changes in lenders' cost of debt, cost of equity and capital structure to changes in the spread between the WACC of banks and BDCs.
The cost of equity has contributed substantially to narrowing the WACC spread between banks and BDCs, particularly in the immediate aftermath of the GFC. The decline in BDCs' CoE relative to banks between 2009 and 2011 contributed almost 100 bp to the decline in the spread (Graph 5.A, yellow line), with subsequent changes being more gradual.
A steady increase in BDC leverage was the other main contributor to the narrowing of funding costs between banks and BDCs. Changes in the capital structure, ie shifts in the importance of equity vs debt, contributed about 150 bp to the decline in the spread after 2010 (Graph 5.A, blue line). The main driver was an increase in BDC leverage. Since 2011 BDCs' debt-to-equity ratio increased from around 0.4 to over 1 on average (Graph 5.B, blue line). Correspondingly, the share of debt in their WACC increased (red line).
Finally, changes in the cost of debt had little impact on the cost of capital spread overall. If anything, the CoD of BDCs trended slightly upwards with respect to that of banks (Graph 5.A, purple line). This pattern likely reflects the relatively small difference between banks' and BDCs' cost of debt during the low rate period.
The rise in leverage is potentially driven by BDCs' use of cheap debt during the low rate period. The attendant decline in the cost of capital despite rising leverage suggests that the benefits of cheaper debt financing outweigh the costs of increased risk to equity investors as BDCs levered up.17 Additional research is warranted to understand the reasons for the substantial decline in BDCs' funding costs compared with those of banks.
Taken together, the evidence suggests that the growth of BDCs was driven, at least in part, by a decline in their cost of capital relative to that of banks. The patterns uncovered in this section are consistent with the broader finding that supply factors were the primary drivers of private credit's fast rise after 2011 (Box A). That said, BDCs have also experienced rapid growth in the years after 2020, although their cost of capital relative to that of banks has remained constant. This development could imply that some of the growth of BDC lending, or of private credit more generally, stems from its genuine ability to cater to the needs of firms underserved by banks.
Conclusion
This article has examined the growth and drivers of private credit. The footprint of private credit is larger in countries with lower policy rates, more stringent banking regulations and less efficient banking sectors. Moreover, evidence from the United States suggests that BDCs' cost of capital relative to that of banks has steadily declined over the past decade, eroding banks' initial funding advantage.
Our analysis informs the debate on how the relationship between banks and private credit could evolve and affect the nature of financial intermediation and financial stability going forward.
Private credit could complement the existing bank-based system and bring financial stability benefits. Banks are primarily financed via short-term deposits, and uninsured deposits are prone to runs. Private credit funds, with their closed-end structure and matched maturity of assets and liabilities, may be better positioned to hold long-term loans and attendant risks.
An open question is to what extent private credit funds are better at originating, screening and monitoring loans. Their specialisation in narrow market segments could provide informational advantages, and borrowers appear to value the flexible terms of private loans. It remains to be seen whether the expected returns of private credit are commensurate with the risk-taking involved or whether lending standards deteriorate in the face of continued credit expansion – in particular because private credit, being a fairly young asset class, has not yet gone through a full credit cycle. At the very least, the increasing prevalence of partnerships between private credit funds and banks suggests that banks, which have the customer relationships, loan officers and ability to provide liquidity through eg lines of credit, might still have an advantage in arranging loans.
Another question is whether private credit funds can maintain their comparative edge. As the leverage of BDCs – and private credit funds more generally – increases, their advantage in holding risk may diminish. If private credit succeeds in attracting more retail investors, eg by migrating to more open-ended structures, liquidity mismatches between assets and liabilities would ultimately rise. Private credit would then be increasingly subject to similar vulnerabilities to banks. Relatedly, with the era of persistently low interest rates coming to an end, the fall in BDCs' cost of capital may reverse. In addition, as retail investors may have a limited understanding of funds' portfolio concentration, striking the right balance between specialisation and diversification within funds is bound to become more challenging. Indeed, funds may dilute their competitive advantage of local expertise if they diversify.
From a financial stability perspective, developments in funds' investor base, including the growing role of insurance companies and retail investors, as well as funds' leverage and degree of portfolio concentration warrant monitoring. This is especially relevant in light of growing interlinkages between banks and private credit.
References
Abadi, J, M Brunnermeier and Y Koby (2023): "The reversal interest rate", American Economic Review, vol 113, no 8, pp 2084–120.
Aldasoro, I, S Doerr and H Zhou (2022): "Non-bank lenders in the syndicated loan market", BIS Quarterly Review, March, pp 15–29.
Aramonte, S and F Avalos (2019): "Structured finance then and now: a comparison of CDOs and CLOs", BIS Quarterly Review, September, pp 11–14.
-------- (2021): "The rise of private markets", BIS Quarterly Review, December, pp 69–82.
Baker, M and J Wurgler (2015): "Do strict capital requirements raise the cost of capital? Bank regulation, capital structure, and the low-risk anomaly", American Economic Review, vol 105, no 5, pp 315–20.
Block, J, Y S Jang, S Kaplan and A Schulze (2024): "A survey of private debt funds", Review of Corporate Finance Studies, vol 13, no 2, pp 335–83.
Board of Governors of the Federal Reserve System (2023): "Financial stability risks from private credit funds appear limited", Financial Stability Report, May.
Caballero, J, S Doerr, A Mehrotra and F Zampolli (2025): "How far can digital innovation improve credit to small firms in emerging market economies?", BIS Bulletin, no 99.
Chernenko, S, I Erel and R Prilmeier (2022): "Why do firms borrow directly from nonbanks?", Review of Financial Studies, vol 35, no 11, pp 4902–47.
Chernenko, S, R Ialenti and D Scharfstein (2024): "Bank capital and the growth of private credit", Working Paper.
Cortés, K, Y Demyanyk, L Li, E Loutskina and P Strahan (2020): "Stress tests and small business lending", Journal of Financial Economics, vol 136, no 1, pp 260–79.
Davydiuk, T, T Marchuk and S Rosen (2024): "Direct lenders in the US middle market", Journal of Financial Economics, vol 162, article 103946.
Dick-Nielsen, J, J Gyntelberg and C Thimsen (2022): "The cost of capital for banks: evidence from analyst earnings forecasts", Journal of Finance, vol 77, no 5, pp 2577–611.
Doerr, S (2021): "Stress tests, entrepreneurship and innovation", Review of Finance, vol 25, no 5, pp 1609–37.
-------- (2024): "Bank geographic diversification and funding stability", BIS Working Papers, no 1221, October.
Doerr, S and P Schaz (2021): "Geographic diversification and bank lending during crises", Journal of Financial Economics, vol 140, no 3, pp 768–88.
Drechsler, I, A Savov and P Schnabl (2017): "The deposits channel of monetary policy", Quarterly Journal of Economics, vol 132, no 4, pp 1819–76.
Erel, I, T Flanagan and M Weisbach (2024): "Risk-adjusting the returns to private debt funds", National Bureau of Economic Research Working Papers, no 32278, March.
Goetz, M, L Laeven and R Levine (2016): "Does the geographic expansion of banks reduce risk?", Journal of Financial Economics, vol 120, no 2, pp 346–62.
Gropp, R, T Mosk, S Ongena and C Wix (2019): "Banks response to higher capital requirements: evidence from a quasi-natural experiment", Review of Financial Studies, vol 32, no 1, pp 266–99.
International Monetary Fund (IMF) (2024): "The rise and risks of private credit", Global Financial Stability Report, chapter 2, April, pp 53–76.
Jang, Y S (2024): "Are direct lenders more like banks or arm's-length investors?", Working Paper.
Kashyap, A, J Stein and S Hanson (2010): "An analysis of the impact of 'substantially heightened' capital requirements on large financial institutions", Working Paper.
Levine, R, C Lin and W Xie (2021): "Geographic diversification and banks' funding costs", Management Science, vol 67, no 5, pp 2657–78.
Sarto, A and O Wang (2023): "The secular decline in interest rates and the rise of shadow banks", Working Paper.
Uhlig H (2005): What are the effects of monetary policy on output? Results from an agnostic identification procedure", Journal of Monetary Economics, vol 52, no 2, pp 381–419.
Van Steenis, H (2025): "The big new role for private credit", Financial Times, 10 January.
Annex A
Regarding the four main regressors in our econometric model, the policy rate varies at the quarterly level, whereas the stringency of capital regulation, the financial institutions index and the non-financial corporation (NFC) debt-to-GDP ratio are at yearly frequencies. A short description of the variables is as follows.
Policy rate: interest rate set by national central banks (or the European Central Bank in the case of euro zone countries) at the end of the quarter (source: BIS database).
Financial institutions (FI) index: an aggregate of (i) the financial institutions depth (FID) index, which uses data on bank credit to the private sector in per cent of GDP, pension fund and mutual fund assets to GDP, and insurance premiums to GDP; (ii) the financial institutions access (FIA) index, which uses data on bank branches per 100,000 adults and ATMs per 100,000 adults; (iii) the financial institutions efficiency (FIE) index, which uses data on banking sector profitability and cost measures and spreads (eg return on equity and net interest margin) (source: IMF Data Portal).
Bank stringency: the regulatory stringency variable is constructed as an index (normalised between zero and one) based on the World Bank's Bank Regulation and Supervision Survey. The index takes a value between zero (least stringent) and one (most stringent) based on questions about bank capital requirements, disclosure, the legal powers of supervisory agencies etc (source: World Bank).
NFC debt: debt of non-financial corporations (loans and debt securities) as a percentage of GDP (source: IMF Data Portal).
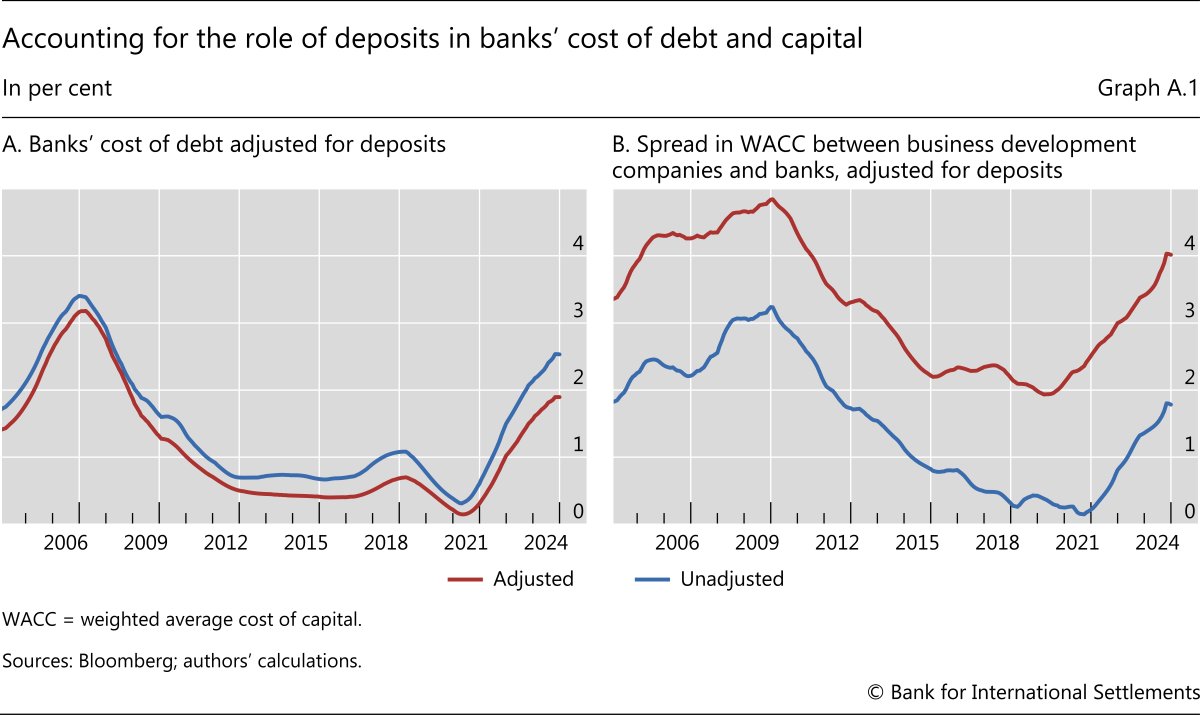
Graph A.1.A shows banks' cost of debt (CoD) in the original Bloomberg series as well as the CoD when we adjust the initial CoD for the cost and weight of deposits. To this end, we use data from the US call reports to compute the deposit rate as total deposit expense over lagged total deposits. We then recompute the CoD as (1 – deposits/assets) X CoD + deposits/assets X deposit rate for each bank.
Graph A.1.B shows the spread between the weighted average cost of capital (WACC) of business development companies and that of banks, once without adjusting the WACC for the cost of deposits and once with adjustments. While the levels are different, the dynamics are nearly identical.
Endnotes
Graph 1.B: Private funds: pooled investment vehicles not registered under the usual securities laws and regulations, such as hedge funds, private equity funds and venture capital funds. Non-profits: foundations, endowments and charitable organisations. Other: investors that do not fit traditional categories, such as foreign entities, special purpose vehicles, family offices, trusts, estates or other unconventional investment vehicles.
Graph 2.B: Cleantech: technologies aimed at reducing environmental impact. Industrials: production and distribution of goods and services for industrial use. Infrastructure: development and maintenance of physical systems like transportation, utilities and buildings. Life sciences: study and application of biology and related sciences to improve health. Manufacturing: production of goods using labour, machines and tools. Oil and gas: exploration, extraction, refining and distribution of oil and natural gas. Technology, media and telecommunications (TMT): industries focused on technological innovation, media content and communication services. Others: industries that do not fit in the aforementioned categories, such as financial technology, mobile, software as a service and other small industries.
Graph 4: The sample includes 11 banks and 55 business development companies. The cost of equity measures are taken from Bloomberg (mnemonic: WACC_COST_EQUITY) and are based on the capital asset pricing model (CAPM). The cost of debt is computed as the after-tax weighted average cost of debt (mnemonic: WACC_COST_DEBT), calculated using government bond rates, a debt adjustment factor, the proportions of short- and long-term debt to total debt and the stock's effective tax rate. The cost of capital is computed as the weighted average cost of capital, which includes the cost of debt, cost of preferred equity and cost of equity.
1 The views expressed are not necessarily those of the Bank for International Settlements. We thank Giulio Cornelli and Rudraksh Kansal for excellent research assistance. For helpful comments, we are also grateful to Ryan Banerjee, Mathias Drehmann, Marc Farag, Gaston Gelos, Bryan Hardy, Wenqian Huang, Ulf Lewrick, Andreas Schrimpf, Hyun Song Shin and Frank Smets. All remaining errors are ours.
2 For a general description of private markets, including private equity, see Aramonte and Avalos (2021). For a detailed description of private credit, including financial stability risks, see IMF (2024).
3 BDCs are required to make at least 70% of their investments in private or public companies with equity values below $250 million and to pay out 90% of income as dividends, which are taxed as ordinary income to shareholders. For background on BDCs, see Davydiuk et al (2024).
4 Collateralised loan obligations are another prominent segment of the private credit ecosystem. They do not originate loans to borrowers themselves but mainly invest in leveraged loans issued by banks or other private credit lenders to sub-investment grade firms. See Aramonte and Avalos (2019) for a detailed description.
5 Van Steenis (2025).
6 Private credit funds yield high total returns compared with other debt instruments. For example, the rate spread (annual rate over Libor or SOFR) averages about 630 basis points (bp) on loans by private credit funds, exceeding that on leveraged loans by about 300 bp. However, Erel et al (2024) find that once one accounts for risk and fees, private credit does not provide abnormal returns.
7 For comparison, in the United States total commercial and industrial loans by banks grew from around $1.2 trillion in 2010 to $2.8 trillion in 2023. Bank loans to companies in the euro area averaged around €4.5 trillion to €5 trillion over the past two decades.
8 For example, diversified banks are less risky (Goetz et al (2016)), which translates into lower funding costs (Levine et al (2021), Doerr (2024)) as well as better access to wholesale funding and more lending during crises (Doerr and Schaz (2021)).
9 Cortés et al (2020) and Doerr (2021) show that post-crisis stress tests in the United States have reduced banks' credit supply to small and young firms in riskier markets. For Europe, Gropp et al (2019) show that an increase in capital requirements made banks reduce their risk-weighted assets, in particular loans to riskier corporations. For a discussion, see also Kashyap et al (2010). However, why banks have reduced their lending while more equity-dependent lenders have increased theirs remains an interesting question for future research.
10 Our results remain robust across various regression specifications that (i) exclude the US from our sample; (ii) include time fixed effects, thereby controlling for global factors; (iii) use alternative measures of banking sector developments; and (iv) exclude the bank stringency variable, allowing us to estimate the regressions on a longer sample (2001–21).
11 The median values of the FI index in our sample of AEs and EMEs are 0.79 and 0.43, respectively. The FI index varies mainly across countries rather than over time, ie our estimate captures the tendency of countries with lower FI index values to have more private credit.
12 For expositional clarity we have omitted the cost of preferred stock (CoP) from the discussion, as only a few companies have preferred stock and its share of total capital is typically small. Bloomberg computes the WACC according to the following formula: WACC = [ CoD x (TD/V) ] + [ CoP x (P/V) ] + [ CoE x (E/V) ], where TD is total debt, V is total capital, P is preferred equity and E is equity capital.
13 For example, BDCs depend primarily on equity as well as revolving credit and corporate debt, ie notes and bonds (Chernenko et al (2024)) and are open to retail investors. BDCs also face a regulatory limit on their debt-to-equity ratio of 2:1.
14 Another explanation for the persistent gap could be more stringent capital requirements, but the evidence is mixed. Baker and Wurgler (2015) show that capital regulation increases the cost of capital and loan rates by raising the cost of equity due to the so-called low-risk anomaly in equity markets. The anomaly refers to the counterintuitive observation that lower-risk stocks can generate higher risk-adjusted returns than higher-risk stocks. Using an alternative approach, Dick-Nielsen et al (2022) confirm the low-risk anomaly in equity markets but do not find evidence of regulation increasing the cost of capital for banks.
15 Bloomberg's CoD measure likely overstates the cost of deposits for banks, as it assumes they pay the same rate as other short-term debt, potentially leading to an overestimation of the cost of debt and capital for banks. Adjusting the CoD for observed deposit rates leads to a level shift, reducing banks' CoD and WACC. However, dynamics relative to BDCs remain unaffected (see Annex A).
16 For expositional clarity we omit the volatile period after 2019.
17 One possibility is that with falling default probabilities and improving economic conditions after the height of the GFC and euro area sovereign debt crisis, BDCs were able to increase leverage without escalating their cost of debt and cost of equity, capitalising on enhanced creditworthiness and investor appetite for yield.