Investor optimism prevails over uncertainty

Despite lingering risks, investor optimism about the near-term outlook set the tone for financial markets during the review period.1 The global economy seemed to be heading for a smooth landing, and the results of the US presidential election were conclusive. As a result, stock markets rose and credit spreads narrowed, easing global financial conditions. At the same time, rising government bond yields and an appreciating US dollar tightened them, pulling in different directions. Measures of risk premia and volatility ticked up in bond markets, amid signs that investors were pricing in higher fiscal and (geo-)political risks. However, the markets for risk assets mostly shrugged off these uncertainties and sentiment remained positive on balance.
Government bond yields generally rose, especially in the United States. The economy's strength there continued to surprise on the upside, pushing Treasury yields higher despite two consecutive policy rate cuts. More subdued activity in Europe meant that expectations of future rates were mostly unchanged and yields rose by less. Japanese government bond yields edged up as the Bank of Japan continued on its gradual path of policy normalisation. Rising US yields went along with a surge in the US dollar, a trend that intensified in the wake of the election.
Reemerging concerns about the fiscal situation in several jurisdictions, and quantitative tightening in others, added to the upward pressure on yields. Rising term premia, (more) negative swap spreads and widening sovereign spreads suggested that investors demanded a higher compensation to absorb additional debt supply.
Equity and credit markets posted substantial gains. US stocks reached all-time highs following the election, and Chinese stocks surged early in the review period in response to stimulus announcements. Elsewhere, stock market performance was more subdued. Corporate spreads continued to compress, and in some segments fell to multi-year lows. Buoyant risky asset markets counteracted the effect of rising yields and a strong US dollar on overall financial conditions. At the same time, there were signs that investors remained attuned to downside risks, with the costs of hedging in options markets pointing to lingering future uncertainties.
Financial conditions in emerging market economies (EMEs) tightened. With few exceptions, equity markets declined, currencies depreciated against the dollar and bond yields rose. China's stimulus announcement resulted in positive, albeit short-lived, spillovers to equity markets of EMEs with strong trade links to China. In currency markets, somewhat higher volatility reduced incentives for currency carry trades.
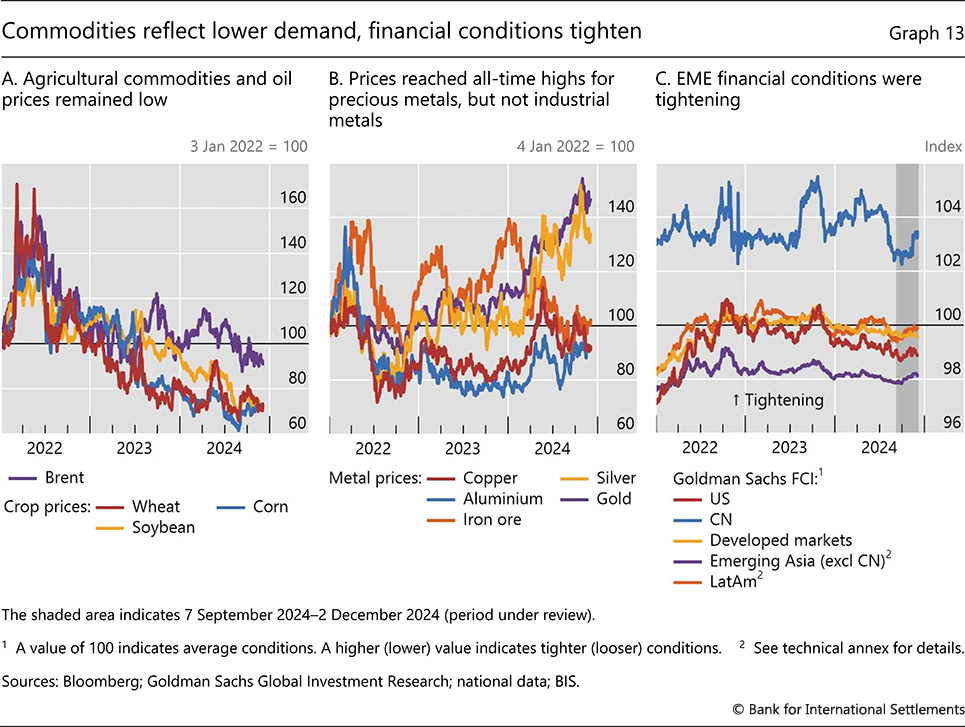
Slowing growth in China was reflected in depressed commodity prices. The impact was stronger in segments such as agricultural commodities and base metals, where demand from China is particularly large. Only the prices of gold and silver continued to rise, before retreating after the US election, possibly reflecting their perceived role as a hedge against geopolitical and inflation risks.
Key takeaways
- Rapidly rising US yields and a soaring US dollar set the tone for fixed income and currency markets. Moves in other core bond markets followed a similar but more muted path, reflecting diverging macroeconomic conditions across regions.
- Risk-taking continued to be buoyant in equity and particularly credit markets, as investors largely shrugged off (geo-)political risks.
- EME financial conditions tightened, with higher bond yields, declining equity markets and headwinds posed by a stronger dollar.
Bond markets diverge as US yields soar
Over the review period, global fixed income markets resumed their divergence on the back of changing perceptions of the future paths of monetary policy and macroeconomic outlooks. While readings generally pointed at inflation converging towards targets, economic activity indicators painted a varied picture, as substantial strength in the United States contrasted with softness elsewhere. Additionally, potential concerns about the fiscal positions in some jurisdictions emerged as another key driver of bond markets. The US dollar appreciated initially with rising US yields and then surged further following the election.
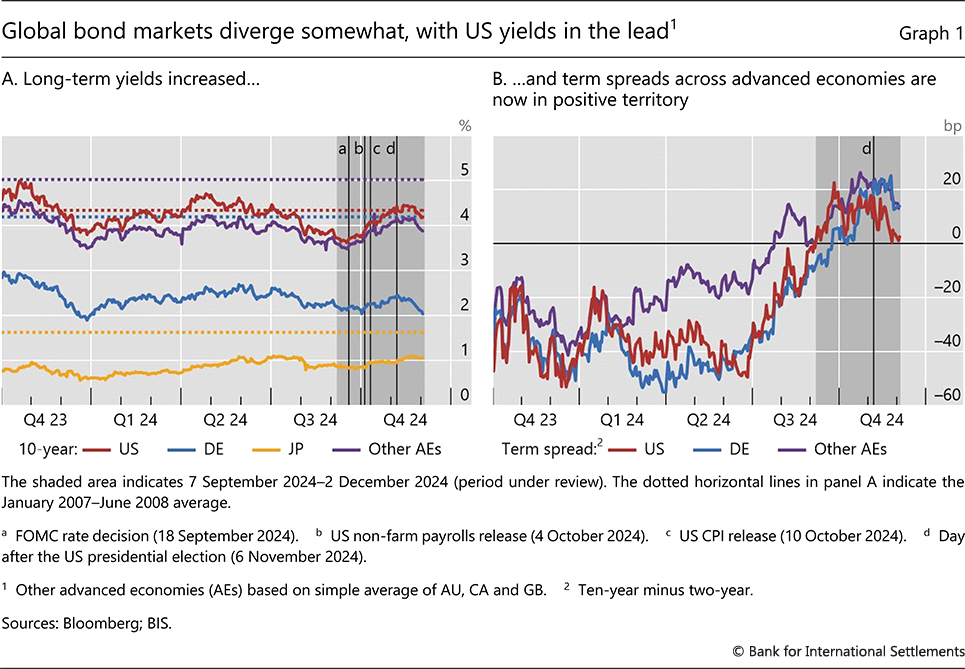
Long-term yields rose across most advanced economies (AEs), led by soaring US Treasury yields for most of the review period. Despite the Federal Reserve's 50 basis point rate cut in September, US yields shot up in October. Ten-year Treasury yields rose by over 80 basis points from the trough reached on 16 September, before retracting somewhat late in the review period. Yields in other AEs followed a similar pattern, though with more muted movements overall, particularly in the euro area (Graph 1.A). The upward shift in yields initially went alongside a normalisation of the yield curve. Term spreads turned positive across AEs and yield curves broadly steepened, up until long-term yields retracted somewhat (Graph 1.B).
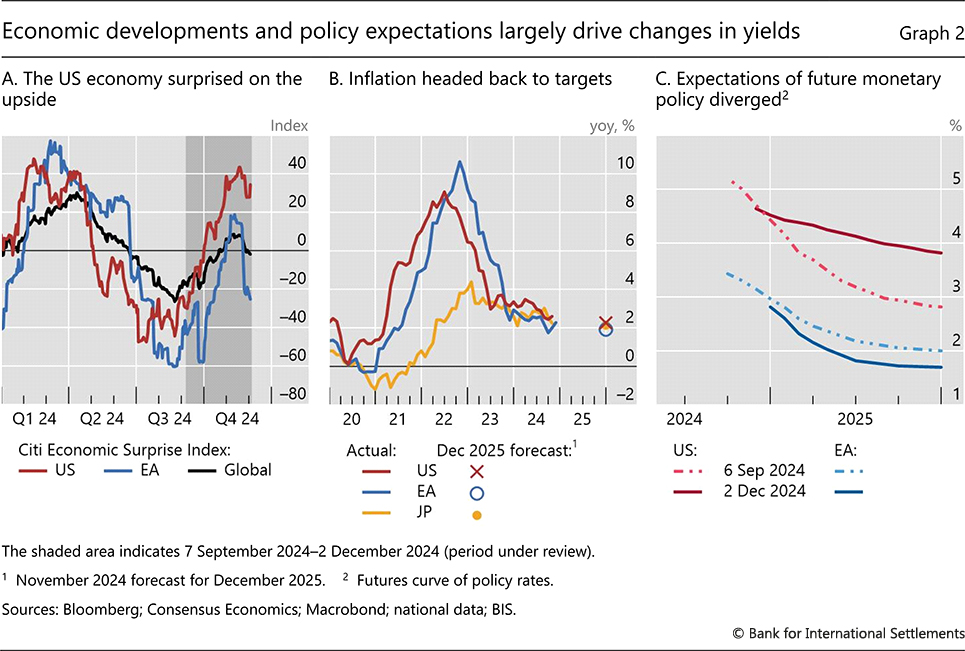
The macroeconomic backdrop, along with expected monetary policy paths, largely underpinned yield movements. Positive macroeconomic surprises continued to accumulate in the United States, but were more short-lived elsewhere (Graph 2.A). As data releases highlighted a resilient labour market and somewhat persistent inflation (Graph 2.B), market participants lifted the expected 2025 path of the federal funds rate (Graph 2.C). Further upward revisions took place following the US presidential election as markets digested the policy changes which were likely to ensue. By the end of the review period, the US term structure flattened again, as near-term yields rose on expectations of a strong economy and fewer policy rate cuts next year. These revisions coincided with signs of increased uncertainty about the level of terminal rates (Box A).
Revisions to the expected monetary policy paths and resulting yield movements were not as pronounced elsewhere. The macroeconomic backdrop in other major AEs was less benign. With weaker growth expected in the euro area in particular, and with inflation even falling below target in September, investors priced in larger rate cuts by the ECB. In Japan, the central bank signalled that it would continue to normalise policy very gradually, as inflation stayed somewhat above target. Long-term Japanese government bond yields rose modestly during the review period, reflecting gradual policy normalisation by the Bank of Japan.
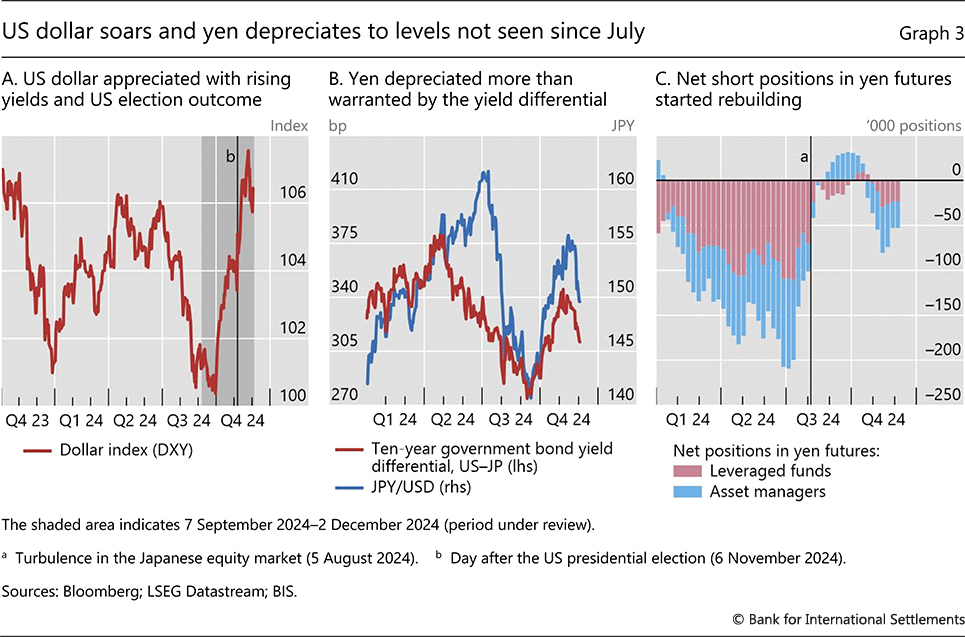
The US dollar soared and the yen touched lows not seen since late July, but developments in fixed income markets only partly explained these movements. The dollar appreciated with rising US yields early in the review period, but then surged even further on the US election outcome (Graph 3.A), even as US long-term yields retracted somewhat. Among AE currencies, the yen depreciated notably vis-à-vis the US dollar (Graph 3.B), by some measures in excess of what would be expected based on the yield gap in the respective bond markets. Net short positions in yen currency futures started rebuilding (Graph 3.C), suggesting investor positioning for further yen weakness. Typically, short positions by financial investors, especially hedge funds, suggest a rise in yen carry trades. However, this time leveraged funds held a smaller share of yen shorts due to increased volatility making such bets riskier (see below). Thus, the current positioning may primarily reflect greater currency hedging by asset managers holding yen assets.
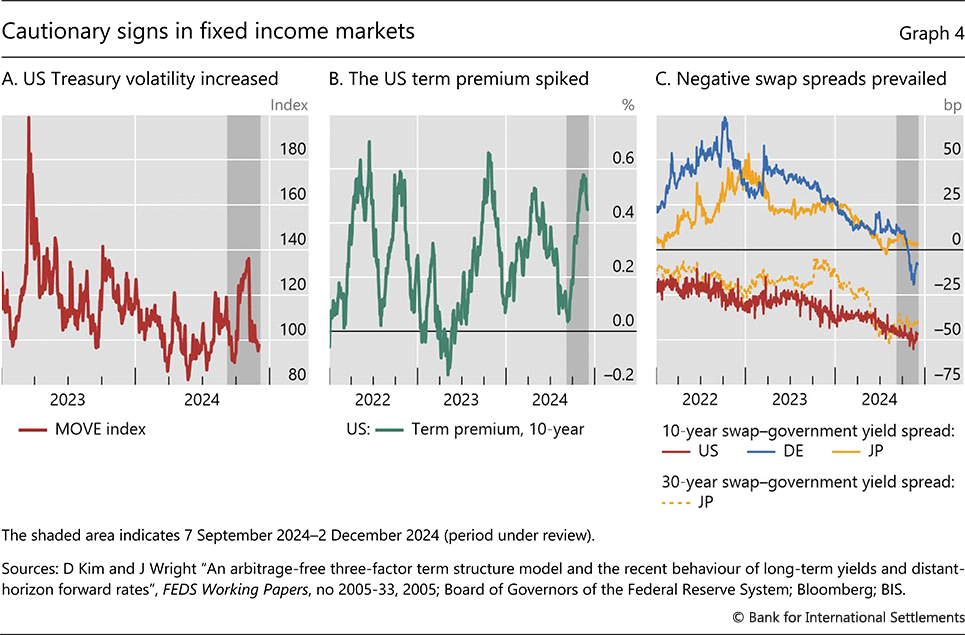
Some indicators in fixed income markets pointed to greater investor uneasiness. For one, the implied volatility of US Treasuries reached the highest level of the year (Graph 4.A) before falling sharply following the election. At the long end of the yield curve, estimates of the term premium edged up through the review period, indicating that investors demanded greater risk compensation for holding long-term US government debt (Graph 4.B).2
Higher measures of risk in fixed income markets coincided with tell-tale signs of a possible supply glut of government bonds. Interest rate swap spreads – the swap rate minus the government bond yield – fell rapidly, indicating that government bonds had become relatively cheaper (and their yields relatively higher). The phenomenon was widespread across currencies and maturities, with the euro and Japanese yen spreads joining their US counterparts in negative territory, even at those shorter maturities where spreads had previously been positive (Graph 4.C). Negative swap spreads appeared to reflect pressures on investors and intermediaries due to the need to absorb more government debt supply in the near future (Box B).
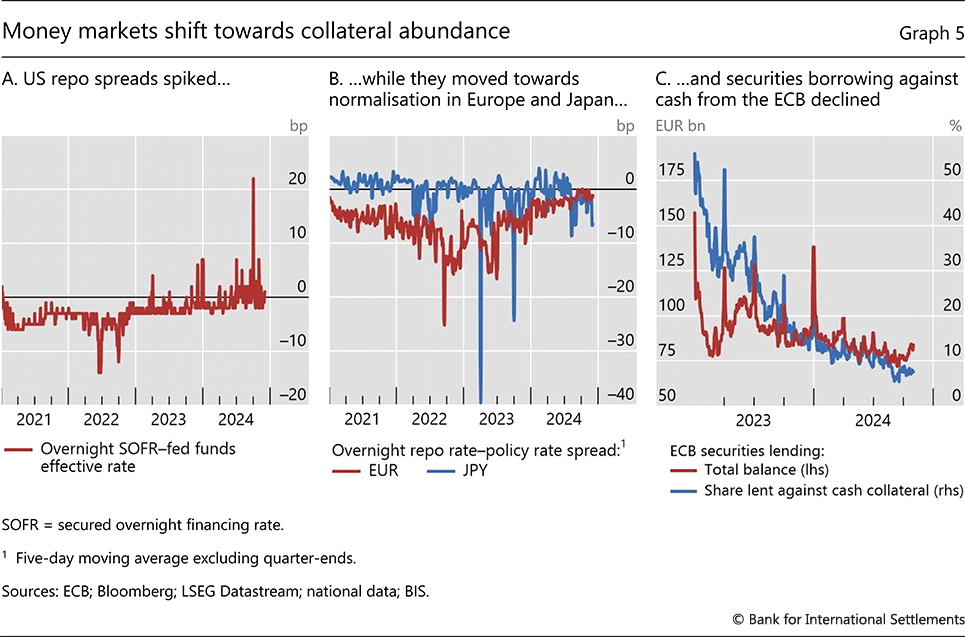
Conditions in short-term funding markets over the review period reflected ongoing quantitative tightening and an increasing shift towards a relative abundance of collateral. In the United States, repo spreads – defined here as the difference between the rate on an overnight repo and the effective federal funds rate – spiked on a few occasions, most notably in September (Graph 5.A). This seemingly reflected the greater repo financing needed to absorb large Treasury issuance as well as constraints on dealers' balance sheets linked to end-of-quarter regulatory reporting pressures. Repo spreads in Japan, while still negative, showed signs of normalisation in recent months (Graph 5.B), pointing to government collateral becoming less scarce, despite still very ample liquidity. In the euro area too, the reversal of collateral scarcity drove repo rates higher.3 Large sovereign issuance and a dwindling ECB footprint contributed to the gradual increase in repo rates over the past 18 months. This shift was also visible in the rapid reduction in take-up of the ECB Securities Lending Programme, particularly against cash collateral (Graph 5.C): investors had less need to turn to the central bank as they were able to obtain collateral from other sources.
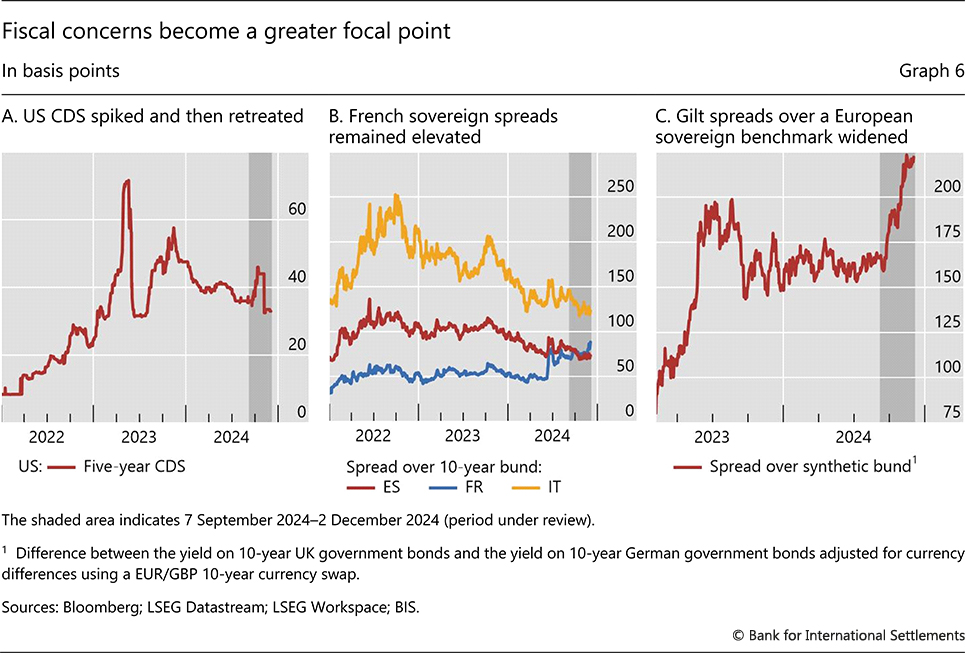
Several indicators pointed to the re-emergence of fiscal concerns. US sovereign credit default swap (CDS) spreads widened in advance of the November presidential and congressional elections, amid worries about the fiscal implications of the uncertain outcomes (Graph 6.A). The subsequent narrowing may have reflected a drop in the likelihood of another debt ceiling impasse, as the next president's party gained a congressional majority. In the euro area, French sovereign spreads remained elevated (Graph 6.B), as the newly appointed government announced larger than expected fiscal deficits, while its ability to command a majority in parliament was itself in doubt. The fiscal outlook also appeared expansionary in Japan on the back of the October parliamentary election results. And it became so in the United Kingdom, where the government announced a relaxation of fiscal rules and more borrowing. This sent yields on gilts higher relative to a synthetic benchmark based on German bunds (expressed in the same currency by using FX swaps to convert the yield in euros into a gilt-equivalent yield) (Graph 6.C).
Equity and credit markets march on
Equity and credit markets were undeterred by political and fiscal risks, posting gains as the global economy continued to show strength. Corporate spreads compressed further, even in the euro area and in Asian markets, where the growth outlook was more mixed. The credit spread compression counteracted the effect of rising government bond yields and a stronger US dollar on overall financial conditions. At the same time, investors appeared to be more attuned to downside risks, at least in equity markets, with the VIX lingering at higher levels following the August turbulence, before retreating somewhat after the US election.
Stock market performance varied significantly across major economies. US equities recorded fresh highs (Graph 7.A), as market valuations were buoyed by the Federal Reserve's 50 basis point September rate cut and by the economy's strength. Stocks, especially small caps, shot up further on 6 November once the outcome of the US election became clear. Bitcoin followed a similar pattern, reaching all-time highs. Across the Atlantic, the more subdued performance of major European equity markets was in line with the relatively weaker economy. Expected earnings for European-listed companies deteriorated further and trailed those of their US peers by a significant margin (Graph 7.B). To some extent, their relative weakness also reflected a greater weight of more cyclical industrial and energy stocks in the index.
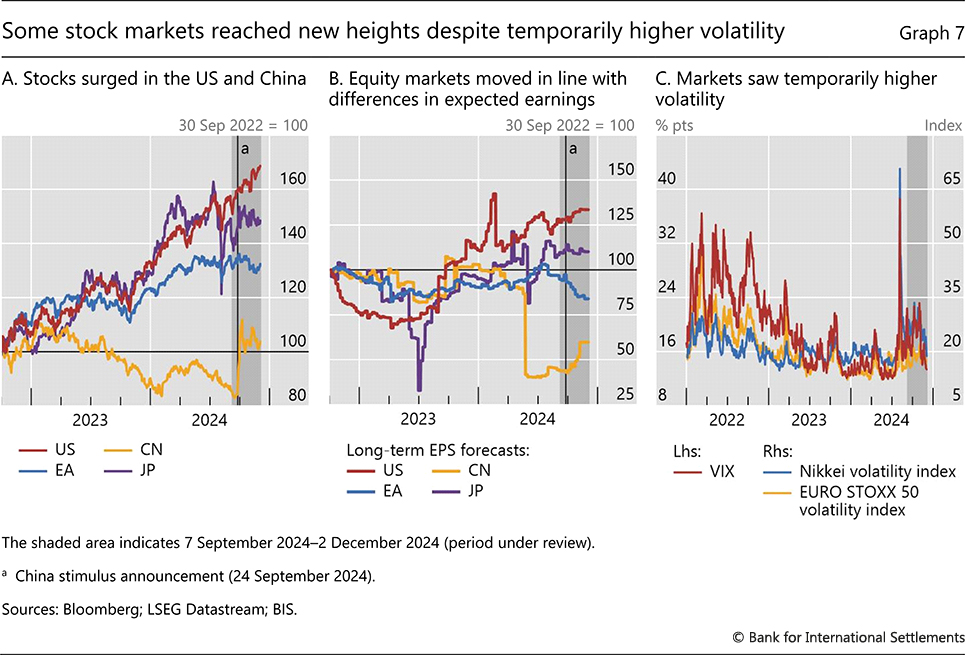
In China, equities rose substantially following the announcement of a large policy stimulus package in late September. That said, the impact on earnings expectations was more muted, as authorities released information on the content of the package in batches. Following the initial jump, Chinese equities moved mostly sideways.
Notwithstanding the large gains of US equity indices, investors appeared to be growing warier of potential risks. After the volatility of early August subsided, the VIX continued to fluctuate within higher ranges (Graph 7.C). It then retreated as the (near-term) uncertainty surrounding the US election was resolved. However, the term structure of the VIX became upward sloping again, with higher expected medium-term volatility.
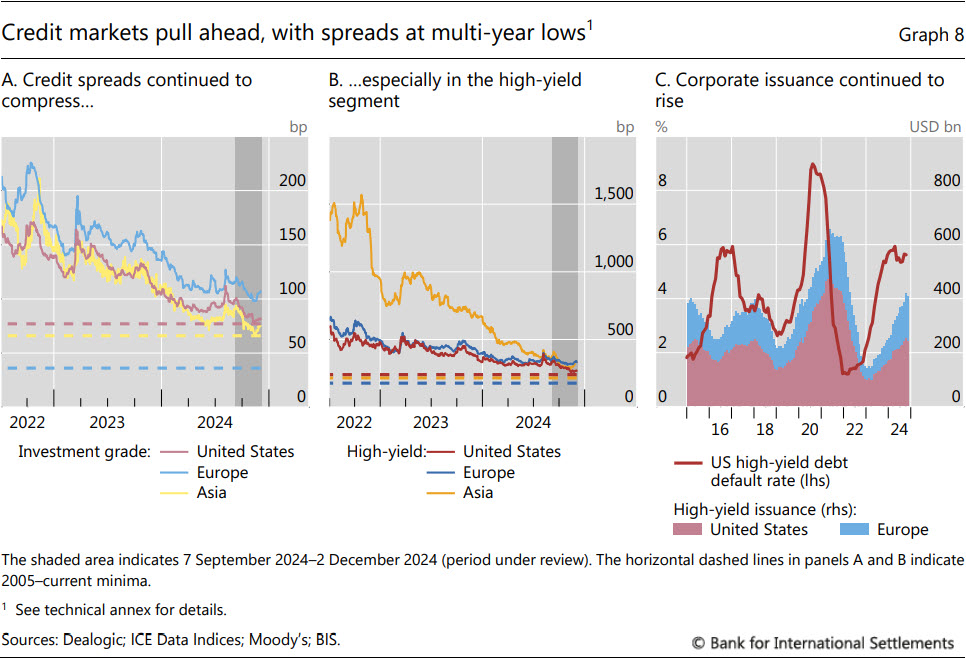
Conditions in credit markets around the globe remained unusually accommodative. Corporate credit spreads stayed compressed relative to their historical watermarks, in both the investment grade and high-yield segments (Graphs 8.A and 8.B), in some cases reaching lows not seen since the mid-2000s. Indeed, some analysts started referring to conditions in corporate funding markets as the "valuation conundrum".
Several underlying forces appeared to put a lid on corporate spreads. For one, debt default rates moderated in the United States (Graph 8.C). Furthermore, corporates' immediate refinancing needs subsided as the maturity wall was pushed out until late 2025–26. In addition, US corporate debt markets continued to see strong foreign demand, with almost two years of consecutive net foreign purchases, according to Treasury International Capital data. Finally, compressed spreads also reflected higher government bond yields rather than lower corporate yields.
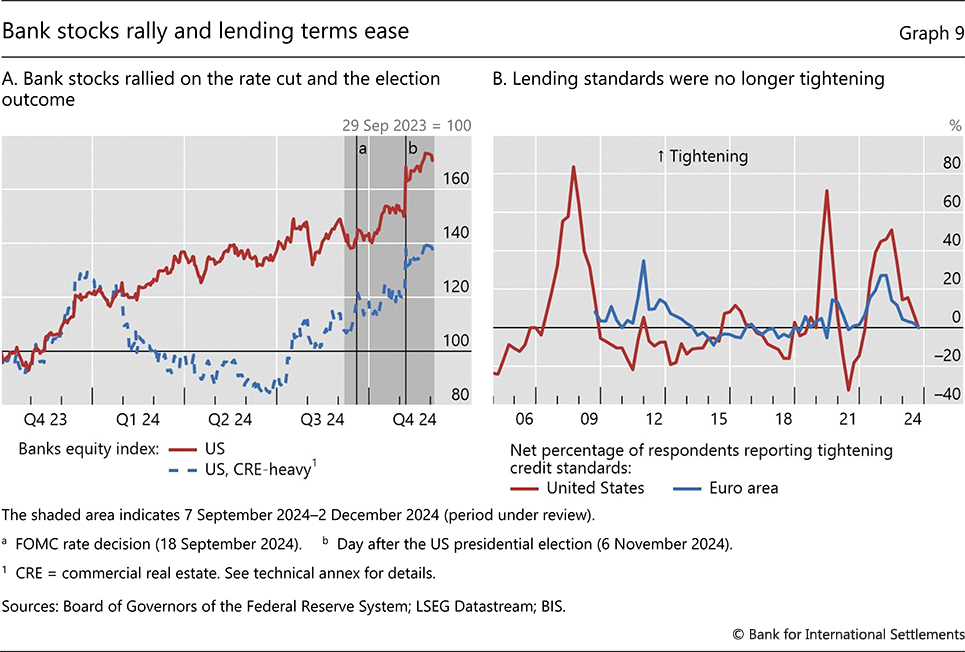
Bank lending conditions eased amid a surge in bank equity prices in the United States. Stock prices of banks began to rally following the September policy rate cut, especially for regional banks with large commercial real estate (CRE) portfolios. The outperformance of CRE-exposed banks reflected shifting investor sentiment towards risk in the sector (Graph 9.A). Bank stock prices rose further after the US presidential election, as investors looked to some regulatory easing. Rising stock prices went hand in hand with easing lending standards (Graph 9.B); declining non-performing loan ratios supported this shift in both the United States and Europe.
EME financial conditions tighten
EMEs faced headwinds and financial conditions tightened. With few exceptions, equity markets declined, currencies depreciated and bond yields rose. China's stimulus announcement caused visible, albeit short-lived, positive spillovers to equity markets of EMEs with stronger trade links to China. Some EME currencies also depreciated on domestic political and fiscal uncertainties.
Bond yields in EMEs diverged across regions, reflecting differences in the macro backdrop, monetary policy cycles and exposure to US developments. Yields in major Latin American economies increased notably (Graph 10.A), tracking their US counterparts more closely than those in other EMEs. Bond yields in Mexico proved especially sensitive to US developments, while those in Brazil reflected mainly strong domestic economic activity and monetary tightening amid rising inflationary pressures. Most Latin American countries also maintained an expansionary fiscal stance, putting further upward pressure on yields. In emerging Asia, by contrast, many central banks cut policy rates for the first time in the cycle and yields rose substantially less. At the end of the spectrum, Chinese government bond yields stayed low, amid subdued growth and policy easing.
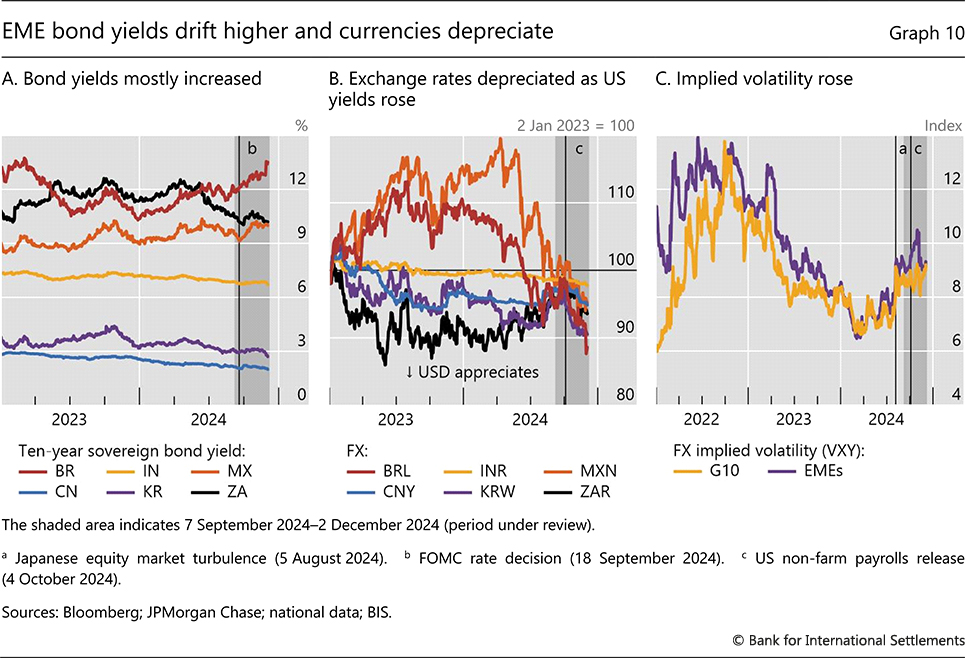
EME currencies generally depreciated against the greenback, while their volatility increased. The depreciation was particularly large for Latin American currencies. The Mexican peso depreciated further on the likelihood of trade tariffs under the new US administration (Graph 10.B). The Brazilian real tumbled in December as the highly anticipated measures to curb public spending were thrown into doubt. In Asia-Pacific, the Korean won was briefly shaken by a bout of domestic political instability. Still, while EME currency volatility picked up in October (Graph 10.C), it decreased somewhat for most EME currencies with the US election results, in line with retreating near-term implied volatility in other markets.
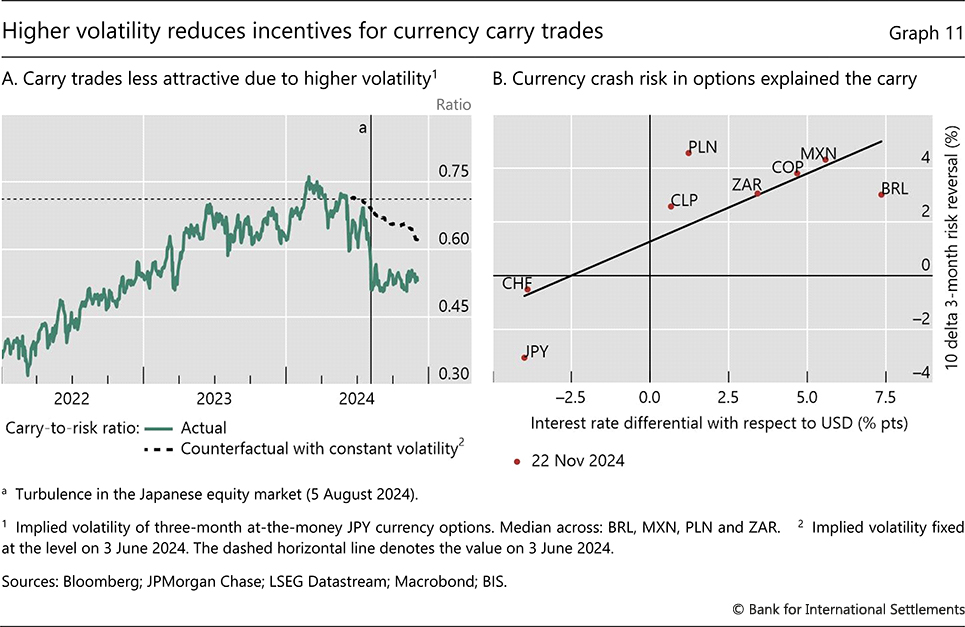
Higher volatility in foreign exchange markets during the review period reduced the incentive for carry traders to rebuild their positions following the August unwind. Carry-to-risk ratios declined substantially, and mostly because of the increase in volatility (Graph 11.A). Furthermore, option-implied measures of skewness showed that investors have grown warier of the potential downside risks associated with these strategies: jurisdictions with the highest interest rate differential to the United States are those where the currency depreciation risk is higher (Graph 11.B).
EMEs with strong links to China saw their equity markets benefit from the Chinese government's stimulus announcement. Following China's stock market jump, which erased more than a year of losses in a single day (Graph 12.A), other markets quickly followed suit. The impact was especially noticeable in Brazil and some other Latin American commodity exporters such as Chile. Within emerging Asia, the Korean and Thai stock markets were among the most affected. However, such spillovers were short-lived, and EME equity indices declined rapidly thereafter.
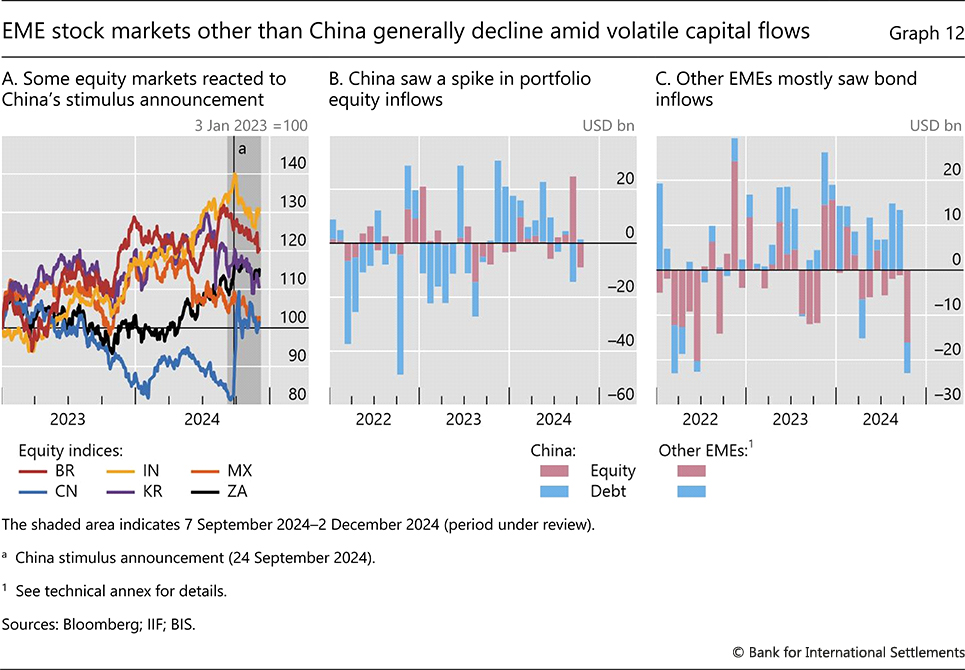
EME portfolio flows at times diverged, while remaining volatile. In China, the surge in equity markets at the beginning of the review period went hand in hand with a sharp, albeit brief, rebound in equity inflows (Graph 12.B). Inflows into other EMEs concentrated mostly in portfolio debt early in the review period (Graph 12.C), but were also volatile, posting sharp outflows across debt and equities in October.
Stronger macroeconomic headwinds in China were also a key driver of commodity prices. The prices of agricultural commodities remained low, despite a brief surge at the time of the stimulus announcement. Oil prices were flat over the review period, notwithstanding a severe escalation of hostilities in the Middle East in October (Graph 13.A). Except for the price of iron ore, which did rise with the announcement, those of industrial metals also declined. Only gold and silver continued to climb, possibly reflecting geopolitical risks, but their prices then sank in the weeks following the US election (Graph 13.B).
On balance, the outcome in EMEs of rising yields, depreciating currencies and declining stock markets was a tightening of financial conditions. The tightening was overall much larger than in AEs and the United States in particular (Graph 13.C).
Technical annex
Graphs 8.A and 8.B: For Asia, ICE Asian Dollar indices.
Graph 8.C: US high-yield debt default rate based on Moody's 12-month rolling US speculative grade default rates. High-yield issuance based on a 12-month rolling sum.
Graph 9.A: Simple average of Bancorp, Citizens Financial Services, Dime Community Bancshares, Flagstar Financials, FVC Bankcorp, Live Oak Bancshares, Peapack-Gladstone Financial, Servisfirst Bancshares, Uscb Financial Holdings and Valley National.
Graphs 12.B and 12.C: Other EMEs = BR, CL, ID, IN, KR, LK, MN, MX, MY, PH, PK, TH, TW and VN.
Graph 13.C: For emerging Asia, GDP-PPP weighted average of ID, IN, KR, MY, PH and TH; for LatAm, GDP-PPP weighted average of BR, CL and MX.
1 The review period covers 7 September to 2 December 2024.
2 Model-based estimates indicate that the increase in the term premium was not due to inflation risk, which has diminished, but to an increase in the real premium.
3 The abundance of collateral is reflected in higher repo rates as lenders demand a higher rate of interest to lend cash against collateral, such as government bonds.