Recent trends in EME government debt volume and composition
(Extract from pages 22-24 of BIS Quarterly Review, September 2017)
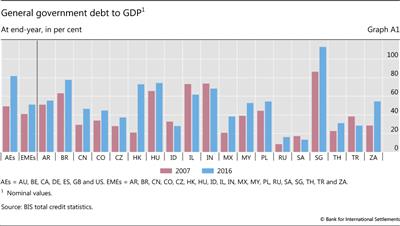
At the end of 2016, the government debt of EMEs totalled $11.7 trillion, more than twice the figure at end-2007. Brazil, China and India accounted for around $8 trillion of this amount. Government debt as a share of GDP rose from 41% to 51% over the same period (Graph A1).
The composition of government debt has changed significantly over time. As debt levels have risen, EME governments have made greater use of domestic and international bond markets: the average share of borrowing through debt securities rose from 62% in 2002 to 80% in 2016. Borrowing is mostly done in local currencies, at longer maturities and at fixed rates. Domestic issuance greatly exceeds international issuance, though the latter is on the rise.
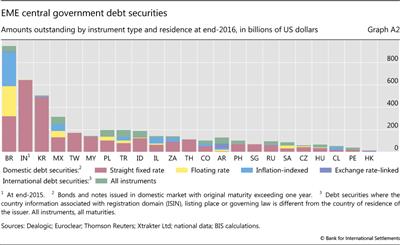
For the 23 jurisdictions sampled and presented in Graph A2, total central government borrowing constituted around $4.4 trillion, of which 14% was denominated in or linked to foreign currencies as at end-2016. The foreign currency share has declined considerably over the past 15 years: it stood at 32% at end-2001.
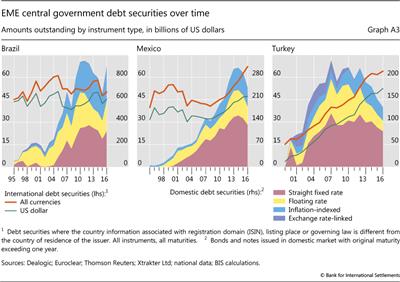
The majority of the debt securities denominated in or linked to a foreign currency were issued internationally. More than 90% of international debt issued by the sampled countries was in US dollars or euros, with the dollar's share rising from 65% at end-2007 to 75% at end-2016. International issues accounted for 35% of total outstanding government debt securities for Saudi Arabia, 32% for Turkey and 30% for Indonesia and Poland. In nominal terms, the leading issuer on international markets is the Mexican central government, with $67 billion outstanding, of which $47 billion is denominated in US dollars, followed by Turkey, with $64 billion, with $53 billion in dollars (Graph A3, centre and right-hand panels).
The share of outstanding domestic government bonds denominated in or linked to a foreign currency is minimal for most jurisdictions (Graph A2). Many countries have reduced such borrowing in recent years. Turkey, for example, used to issue substantial amounts of government debt locally in foreign currency, but had redeemed all of these instruments by the end of 2011 (Graph A3, right-hand panel).
Argentina is an exception to this pattern. It has increased both domestic and international debt issuance linked to or denominated in foreign currency. The Argentine central government has $56 billion of international debt securities outstanding, of which $37 billion is denominated in US dollars. Around 56% of Argentina's outstanding domestically issued central government bonds are denominated in foreign currency, amounting to $41 billion at end-2016. This share has been rising steadily since 2007, when it stood at 28%.
Another notable development in the realm of EME government debt relates to its average maturity, which has risen sharply and for many EMEs is now comparable to that of advanced economies. The average remaining maturity of the sampled EMEs' central government debt securities, 7.7 years, is now only slightly below that of advanced economies, at eight years. The Mexican government has more than doubled the remaining maturity of its domestic debt in the last decade, from around four to eight years. Similar increases also took place in the Philippines and Korea. Among the 23 EMEs sampled by the BIS, South African domestic government debt has the longest remaining maturity at the end of 2016: 16 years. This is considerably longer than in a number of advanced economies - remaining maturity averages 5.7 years for Australia, around 6.5 years for Canada, Germany and Spain, and 5.6 years for the United States - and comparable to the United Kingdom (17.5 years).
Longer maturities have gone hand in hand with greater use of fixed rate instruments (Graph A2). The average share of domestic fixed rate instruments across the sampled EMEs was 75% at end-2016, up from 60% at end-1999. The respective shares for advanced economies were 90% and 94%. Chinese Taipei, Malaysia, Singapore and Thailand issue only straight fixed rate bonds. Chile expanded its share of fixed rate government bonds from zero at the end of 2005 to 11% in 2007 and 40% at the end of 2016. Indonesia increased the share of its outstanding bonds with fixed rates from 20% at end-1999, to 65% in 2007 and to around 94% at end-2016. Almost all of the international issues by the sampled countries were at a fixed rate, with an average remaining maturity of nine years.
There have also been notable changes in the use of inflation-linked debt securities. Some countries have made greater use of this indexation, taking advantage of generally benign inflation conditions. The Brazilian and Mexican governments have been replacing domestic exchange rate-linked and floating rate instruments with fixed rate and inflation-indexed bonds. At end-2016, inflation-indexed bonds accounted for around 34% of domestic Brazilian central government bonds, compared with negligible amounts a couple of decades ago (Graph A3, left-hand panel). A similar shift towards inflation-indexed bonds has happened in advanced economies. In Australia, Canada, Germany, the United Kingdom and the United States, inflation-indexed bonds have accounted for a rising proportion of outstanding government bonds, making up on average around 9% of the outstanding debt stock.
Taken together, these trends should help strengthen public finance sustainability by reducing currency mismatches and rollover risks. The fall in the share of FX-linked debt in the early 2000s may have helped shield EMEs from the global market turbulence of the 2007-09 crisis and its aftermath. Longer maturities and fixed rate debt have also supported the broader expansion and development of capital markets in EMEs: with lengthened government yield curves, other domestic issuers obtain a useful benchmark for their own debt. At the same time, increased duration means that a global rise in bond yields could have a greater impact than previously on the market value of debt, potentially increasing rollover risks and other adverse feedback mechanisms.
 For further information, see Committee on the Global Financial System, Financial stability and local currency bond markets, CGFS Papers, no 28, June 2007. Table C2 in the BIS Statistical Bulletin, updated annually by the BIS from national data, provides an overview of the instrument and maturity structure of central government bond markets for a sample of 30 countries, of which 23 are EMEs. See www.bis.org/statistics/c2.pdf.
 The central government is still the dominant debtor in most countries, accounting on average for 75% of total general government debt at end-2016. But borrowing by other government levels is high in China and India, accounting for around 65% of the total for both countries at end-2015.
 See B Gruić, M Hattori and H S Shin, "Recent changes in global credit intermediation and potential risks", BIS Quarterly Review, September 2014, pp 17-18.


