I. Laying a robust macro-financial foundation for the future
- Chapter I: Data behind the graphs
- Press release: Price stability and fiscal consolidation are key foundations of future prosperity: BIS
Key takeaways
- Following the most synchronised and intense monetary policy tightening in a generation, inflation has declined substantially with little collateral damage so far. The financial system has been largely strain-free since March 2023, and market pricing suggests a smooth landing.
- That said, a number of pressure points could throw the global economy off track. Inflationary pressures may prove more stubborn than anticipated, growth may stall and long-standing fiscal and macro-financial vulnerabilities may lead to stress.
- Monetary policy will need to finish the job on disinflation. Fiscal policy will need to consolidate. Prudential policy will need to remain vigilant and continue efforts to enhance resilience. Structural policy will need to set the basis for sustainable growth and prepare the economy for the challenges ahead.
The global economy appears to be poised for a smooth landing. The sudden post-pandemic burst of inflation was met with the most synchronised and intense monetary policy tightening in a generation. So far, the efforts have borne fruit, defying last year's concerns of looming recessions and very sticky inflation. The financial system has proved resilient. The baseline going forward is a gradual convergence of growth rates to their medium-term trends as inflation approaches central bank targets.
Still, old risks have not gone away while new ones have come into sight. A number of pressure points could compromise the benign baseline scenario. Inflationary dynamics could re-emerge, spurred by ongoing adjustments of relative prices. Geopolitical events and commodity price increases could complicate the last mile of disinflation. Varying exposure to inflationary pressures could deepen the divergences across jurisdictions, bringing about disorderly adjustment in exchange rates and capital flows. Fiscal policies could boost demand at an inopportune time, while debt sustainability concerns could strain the financial system. Depleted buffers and the cumulative effects of past monetary policy tightening could reach tipping points and prompt a sharp squeeze in private demand. Seemingly dormant, macro-financial imbalances could unwind in a costly way.
In this challenging landscape, policies will need to finish the job of guiding the economy back to price stability and set the foundation for durable growth. In doing so, macroeconomic policies will need to keep a firm eye on the longer-term consequences of near-term decisions. Monetary policy will need to stay alert to a re-emergence of inflationary pressures and preserve the regained room for manoeuvre. Fiscal consolidation remains essential to support disinflation and restore debt sustainability. Prudential policy needs to remain vigilant and continue the efforts to strengthen the resilience of the financial system. Structural reform efforts, which have flagged for too long, need to be revived to support higher sustainable growth and a better income distribution. Enhancing growth and resilience through reforms that foster competition, flexibility and innovation will improve economic well-being and ensure the capacity for effective macro-stabilisation policy responses, when the need arises.
This chapter reviews economic and financial conditions over the past year. It then discusses the key pressure points and lays out scenarios for how they might threaten a smooth landing. Finally, it elaborates on the near- and long-term policy challenges.
The year in retrospect
On course for a smooth landing
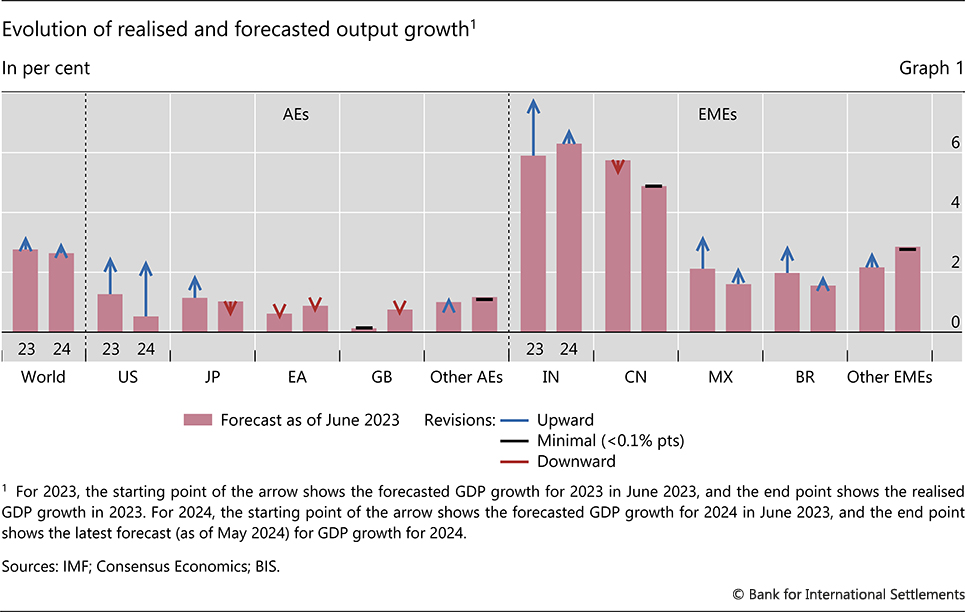
The global economy proved resilient over the past year. Growth surprised to the upside across several major advanced economies (AEs), including the United States and Japan, as well as large emerging market economies (EMEs), such as India, Mexico and Brazil (Graph 1). At 3.2% for 2023, global growth exceeded expectations as of mid-2023, slowing only moderately from 3.5% in 2022. Fears of a global recession proved unfounded. Growth this year is expected to hold up at 3.0%. To date, the smooth-landing trajectory appears intact.
Two factors help explain this surprising resilience.
First, the labour market remained unusually buoyant in relation to output. Unemployment rates stayed close to pre-pandemic levels, edging up only slowly despite sharp monetary policy tightening. Based on historical relationships, the labour market was generally stronger than would have been predicted by output growth (Graph 2.A). Labour market tightness reflected the continued cyclical uplift from the services-led recovery, which is more labour intensive, and pandemic-related behavioural shifts.1 This, in turn, lent support to household income (purple bars in Graph 2.B) and domestic demand, contributing to more resilient activity.
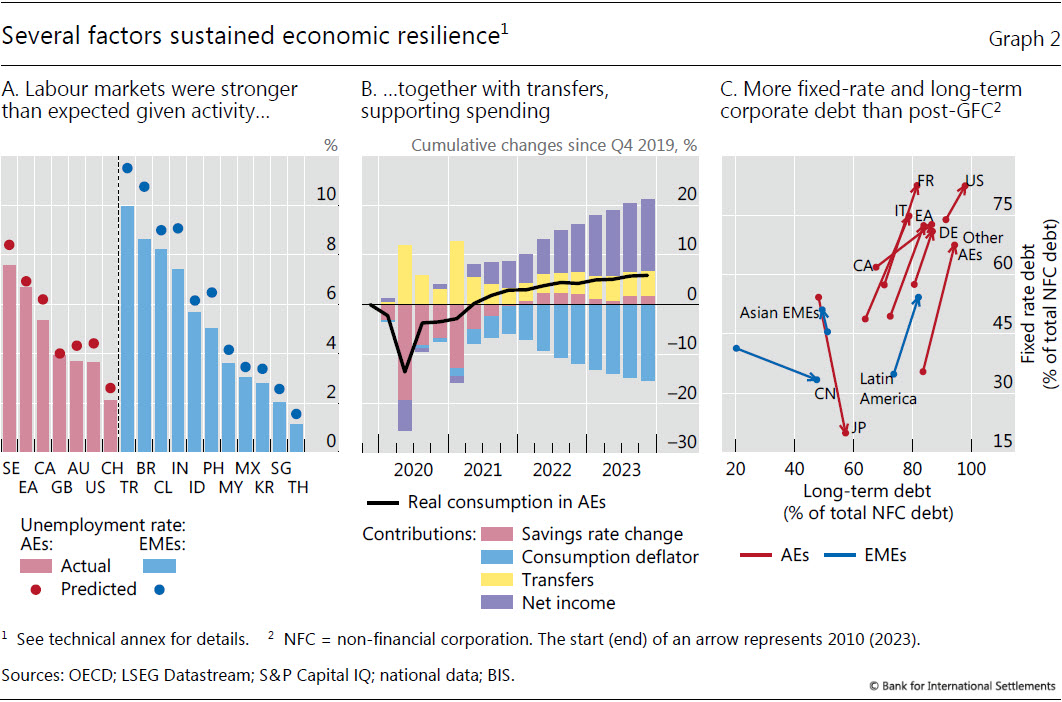
Second, the transmission of monetary policy to the real economy proved smooth and non-disruptive. One reason was the measured pass-through of monetary policy to financial conditions. Buoyant market sentiment kept risk spreads compressed and the financial system remained largely strain-free (see below). Importantly, the pass-through from tighter financial conditions to real activity was dampened by robust household and corporate balance sheets. While private debt levels are high, the prominence of fixed-rate loans and the lengthening of loan maturities delayed the impact of higher rates on borrowers (Graph 2.C). More generally, large cash cushions allowed investment to remain robust, while excess savings from the Covid-19 era and the lingering effects of fiscal support, including energy subsidies (yellow bars in Graph 2.B), played a part in sheltering consumption.
EMEs were resilient, contrary to some earlier tightening cycles, reaping the benefits of stronger policy frameworks and domestic financial systems. Since the early 2000s, the shift towards inflation targeting and greater exchange rate flexibility, supported by larger reserves, had enhanced central bank credibility, helping to anchor inflation expectations and to reduce the pass-through of changes in the exchange rate to inflation (Chapter II). Stronger prudential regulation and supervision had strengthened the banking system's resilience. Fiscal policy frameworks had also improved somewhat, and many EMEs benefited from a greater market tolerance for government indebtedness, hence the broad stability of sovereign credit ratings despite much higher debt levels for many countries. A substantial reduction in currency mismatch in borrowers' balance sheets and the development of domestic-currency bond markets reduced the sensitivity of EME bond spreads to global financial conditions. 2
Not all jurisdictions around the world proved equally resilient, however, and differences in growth became more apparent as the year progressed. Growth was remarkably strong in the United States, supported by substantial fiscal spending. Latin American economies, most notably Brazil and Mexico, performed well, also benefiting from proximity to the United States. By contrast, the euro area, the United Kingdom and several small open AEs registered barely positive growth. Economic activity was also typically weaker in central Europe and emerging Asia. Subdued global trade amid a continued manufacturing slump played a role, given some of these economies' reliance on exports. The greater impact of rising energy prices, especially in Europe, and smaller fiscal support also played a part. In China, domestic real estate woes continued to beset the economy and weigh on consumer confidence, prompting further policy support for the sector. Activity was held up by strong investment in manufacturing and infrastructure as well as by exports.
Sustained disinflation opened the door to a monetary policy pivot
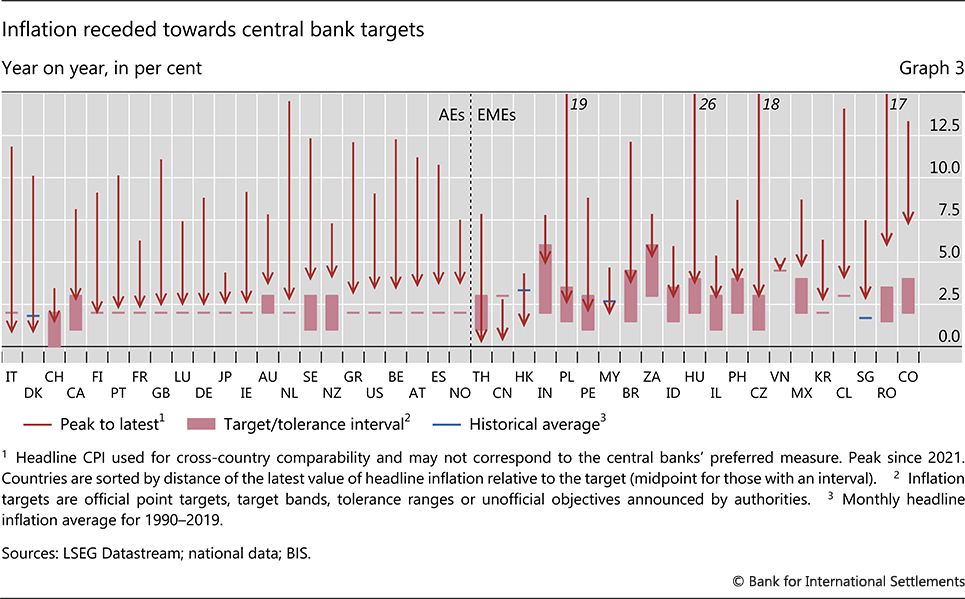
Global inflation continued to recede from the peak it reached in 2022. Inflation was back to around central bank targets across a range of countries, including several euro area economies (Graph 3). In the United States, the disinflation journey largely followed the forecasted path, notwithstanding the upside surprises in early 2024, and inflation remained a little above target. Most EMEs also saw inflation decline, with a few exceptions, such as Argentina and Türkiye. In both Latin America and Asia, disinflation was broad-based, with Thailand and China even seeing falling prices at one point. China's export drive may have acted as a global disinflationary force for importing countries (Box A).
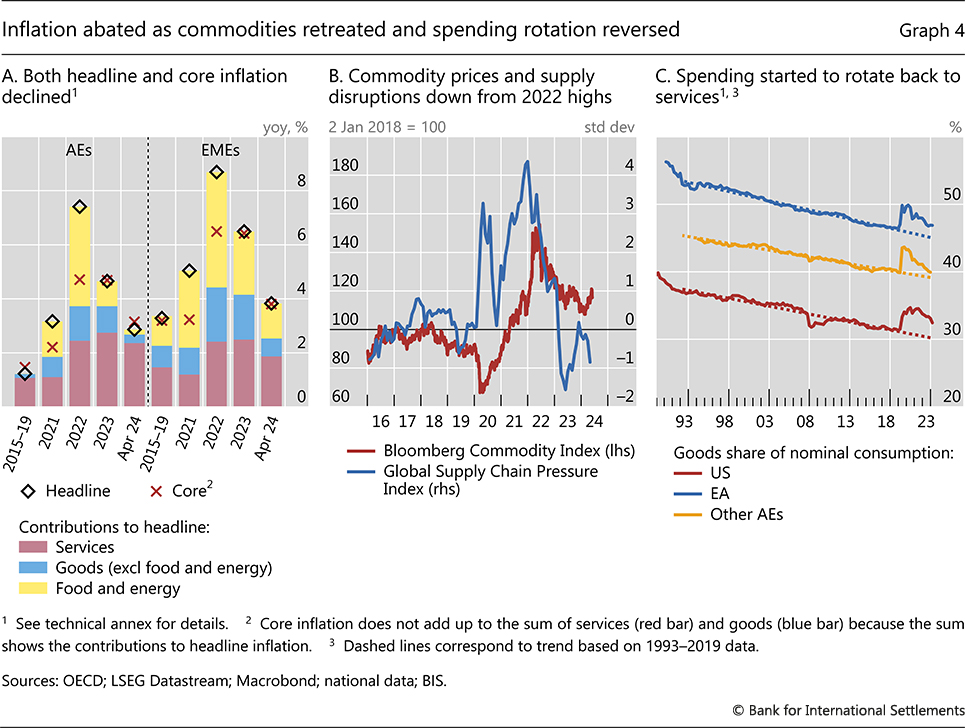
The decline in inflation was common for both core and headline, but headline decreased more, especially in AEs. Headline inflation dropped below 3% in AEs and below 4% in EMEs (Graph 4.A). This was in large part due to commodity prices retreating from 2022 peaks, despite elevated geopolitical tensions (red line in Graph 4.B). By early 2024, contributions to inflation from food and energy had largely disappeared in AEs and had dropped significantly in EMEs (yellow bars in Graph 4.A).
Among core inflation components, moderation in price growth was more pronounced in (core) goods than in services. Benign supply chain conditions (blue line in Graph 4.B) and a continued rotation of spending from goods back to services (Graph 4.C) supported these patterns. The main inflation driver in AEs became services price growth, a more persistent component historically. Similarly, in EMEs, contributions to inflation from services doubled since 2021 and remained large, while contributions from food, energy and other goods shrank.
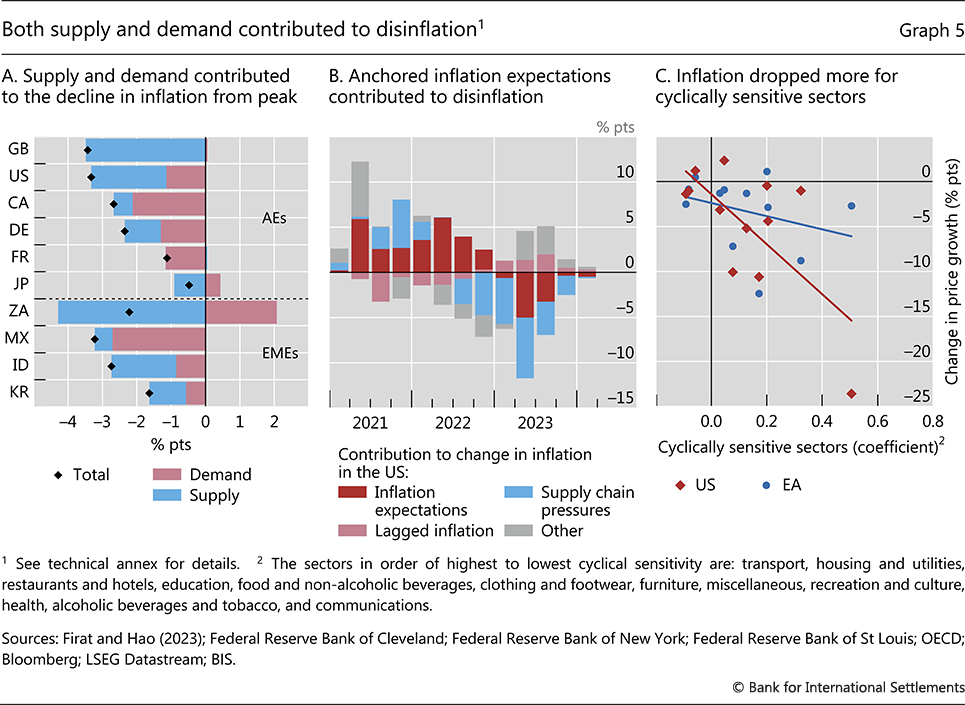
Both supply and demand factors played a role in the disinflation process. Distinguishing their respective contributions is difficult, but results from a range of stylised exercises can help shed some light.
One exercise, which distinguishes supply and demand based on the relationship between price and quantity changes, points to cross-country differences.3 This analysis suggests that more than half of the decline in inflation from its peak reflects increased supply in the United Kingdom, the United States, South Africa, Indonesia and Korea (Graph 5.A). By contrast, weaker demand appears to have accounted for more of the inflation decline in Canada, France and Mexico.
A complementary simple regression exercise provides further insights by breaking down US inflation into the contribution of a wider range of factors (Graph 5.B). According to these estimates, the resolution of supply chain pressures explains a significant portion of the inflation decline since late 2022 (blue bars), confirming the importance of supply factors. Monetary policy has also played a key role (see Box B for further discussion). One important channel is by anchoring inflation expectations, following their upward drift during the inflation flare-up (red bars). Expectations of low and stable future inflation influence current spending as well as the price- and wage-setting decisions of firms and households; anchored expectations therefore limit second-round effects and in turn contribute to the actual decline in inflation in future. Another channel is by restraining demand. Indeed, sectors that are more sensitive to the output gap, such as transportation and food, experienced larger drops in price growth (Graph 5.C). Not captured in these estimates, the globally synchronised tightening has also had an impact by cooling commodity price increases.4
After a notable period of synchronisation, divergence eventually emerged in monetary policy stances across countries. With notable progress towards meeting their inflation targets, some central banks reduced policy rates and others signalled easing ahead. Most central banks in Latin America cut rates, after being among the first to tighten. Among AEs, the Swiss National Bank was the first to cut and was followed by Sveriges Riksbank, while the ECB and the Bank of Canada both lowered their policy rates in June. The Federal Reserve kept policy rates constant, reiterating the need for greater confidence in inflation converging to target before considering an easing.
Changes in policy rates in Asia were more moderate and varied, partly reflecting lower inflation in the region and greater use of other stabilisation instruments, such as foreign exchange intervention. The People's Bank of China eased monetary policy further in response to weak domestic conditions. The Bank of Japan increased the policy rate for the first time since 2007 in response to accumulated evidence that inflation could finally rise to the 2% target on a durable basis. Bank Indonesia raised rates, while several Asian EMEs intervened in foreign exchange markets to mitigate pressure on their currencies linked to interest rate differentials with AEs.
The financial system positioned for a smooth landing
Against this benign macroeconomic backdrop, exuberant financial markets anticipated a smooth landing, in part helped by a lack of major incidents like those in March 2023.
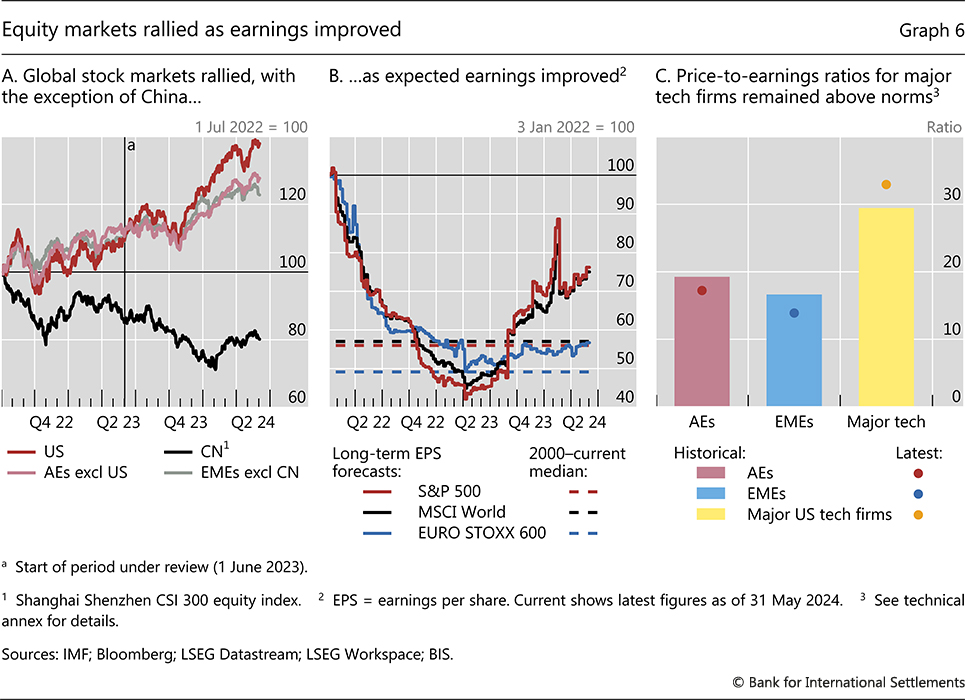
The prospects of lower policy rates and resilient growth, alongside improving earnings, propelled equity markets across most AEs and EMEs (Graphs 6.A and 6.B). The rally was particularly strong in technology stocks, which benefited from optimism related to artificial intelligence (AI). Valuation ratios of AI stocks reached lofty heights, above historical norms (Graph 6.C). China was a notable exception to this general picture, as stocks there slumped at the beginning of 2024 before partly recovering.
Credit markets also reflected the general risk-on sentiment. Credit spreads of investment grade and high-yield bonds continued their downward trajectory from mid-2022. They started the review period above historical norms but finished it deeply below (Graph 7.A). Despite such narrow spreads, corporate bond issuance remained subdued in both the euro area and the United States.
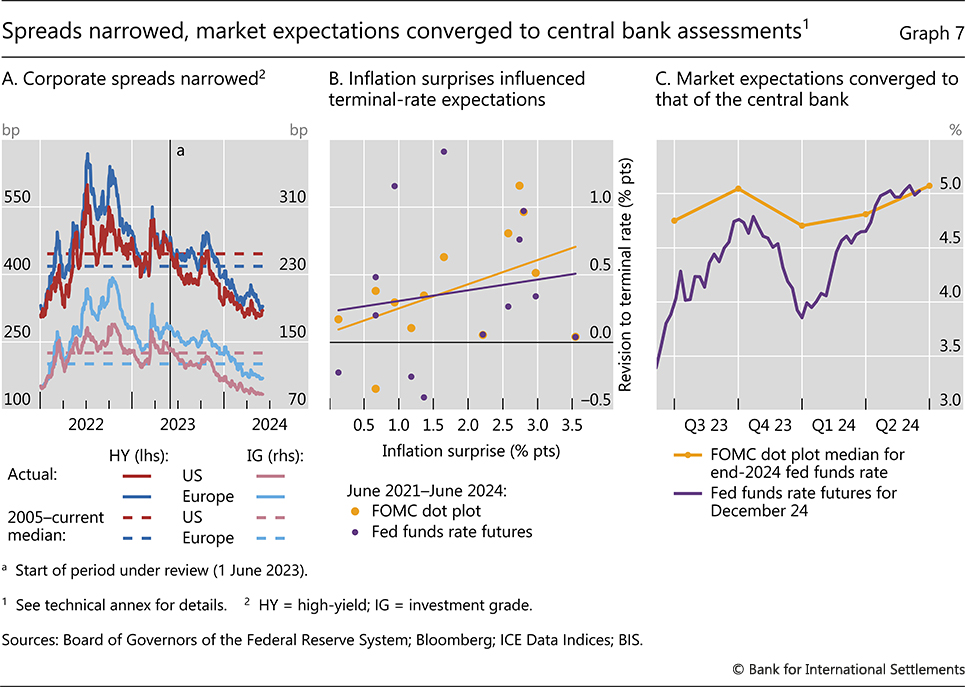
The optimism in financial markets contrasted with more cautious central bank communication. While taking cues from incoming data and policy announcements, market participants anticipated more monetary easing ahead than central banks did for much of the period, especially in the United States. Accordingly, they paid less attention to inflation surprises than the Federal Reserve (Graph 7.B). Still, the perception gap narrowed over time (Graph 7.C), and markets converged to central bank assessments by the second quarter of 2024 amid renewed inflation concerns.
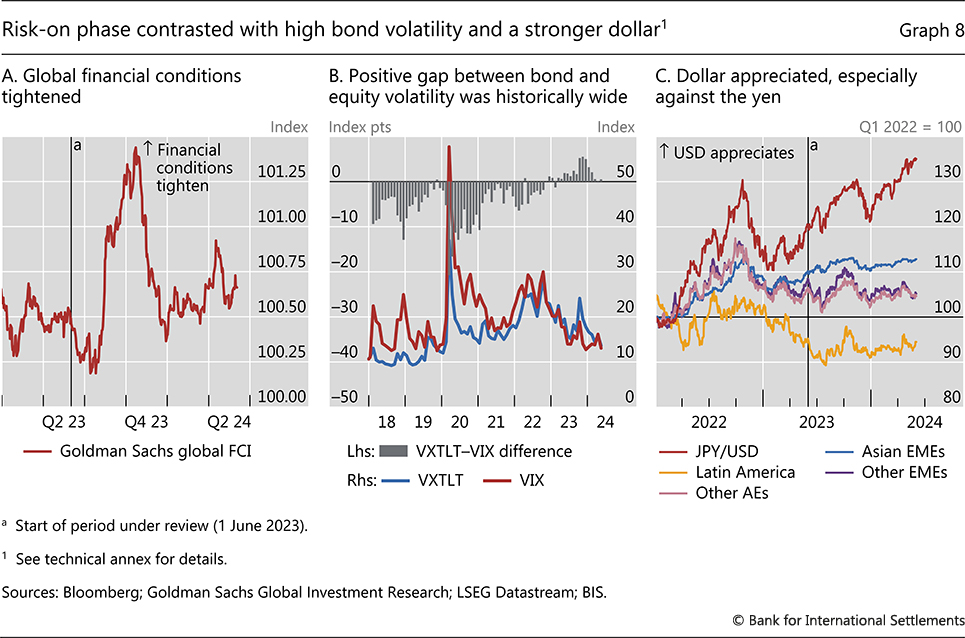
On balance, global financial conditions tightened during the review period, despite the risk-on mood. They tightened sharply in the third quarter of 2023 and loosened through end-2023, finishing the review period tighter than where they started and tighter than historical averages (Graph 8.A). Conditions danced to the tune of evolving perceptions of the degree of monetary easing ahead. Uncertainty about the future path of interest rates was high, to the point that bond volatility hovered well above equity volatility – a rare occurrence. The gap between the two volatilities was positive for most of 2023 and 2024 – and the widest in 20 years – unlike in previous years (Graph 8.B). In contrast to past risk-on episodes, the dollar appreciated (Graph 8.C). Notably, the Japanese yen dropped to record lows against the dollar, on account of interest rate differentials.
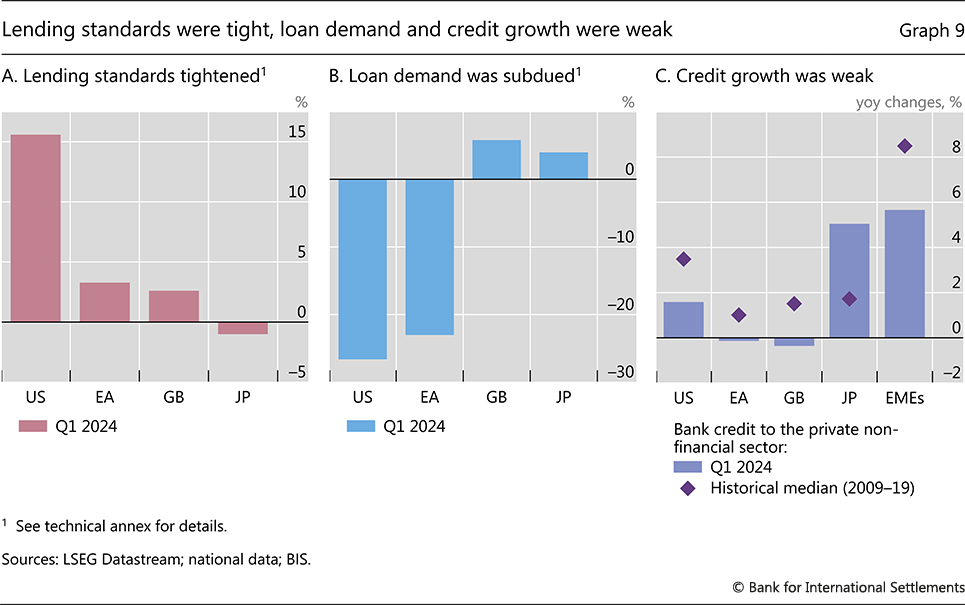
In contrast to the exuberance in financial markets, bank lending remained cautious. Banks reported tighter lending standards (Graph 9.A) and weaker demand for credit across major AEs (Graph 9.B). Credit growth was generally subdued in major AEs, except Japan, as well as in EMEs (Graph 9.C).
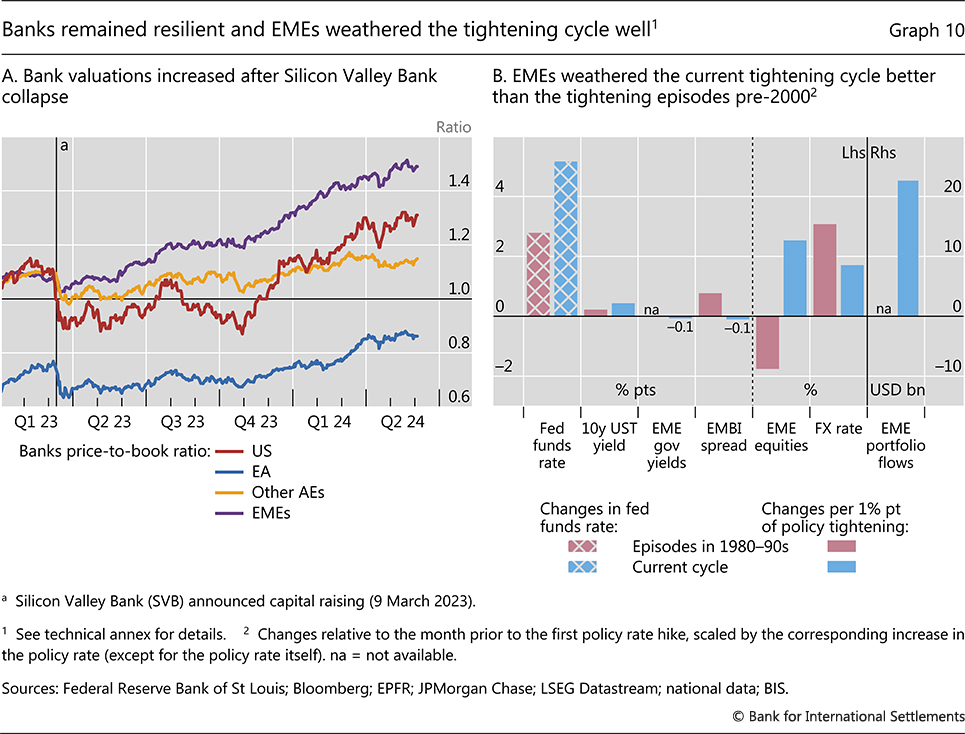
The financial system remained resilient despite the challenges posed by the higher interest rate environment. Some signs of strain did emerge. US regional banks were in the spotlight again, following losses in New York Community Bancorp. And Chinese banks remained under pressure as the problems in the real estate sector continued. That said, the strains were localised and were nothing like those seen in March 2023 among regional banks in the United States or in Europe, where a global systemically important bank, Credit Suisse, had gone under. And any incipient stress was absorbed in an orderly manner. Bank valuations recovered (Graph 10.A), and capital ratios remained stable or improved. Despite one of the most synchronised and fastest tightening cycles in AEs, financial markets in EMEs managed to weather the change very smoothly compared with past episodes (Graph 10.B).
Pressure points
A smooth landing is the central scenario, but several pressure points remain. Four stand out: the underlying inflation trajectory, the macro-financial backdrop, fiscal positions and productivity growth. These pressure points, and their interactions, could compromise the expected benign outcome.
Inflation pressure points
Despite encouraging progress to date, two key and closely related relative price adjustments could stretch out the path towards inflation targets.
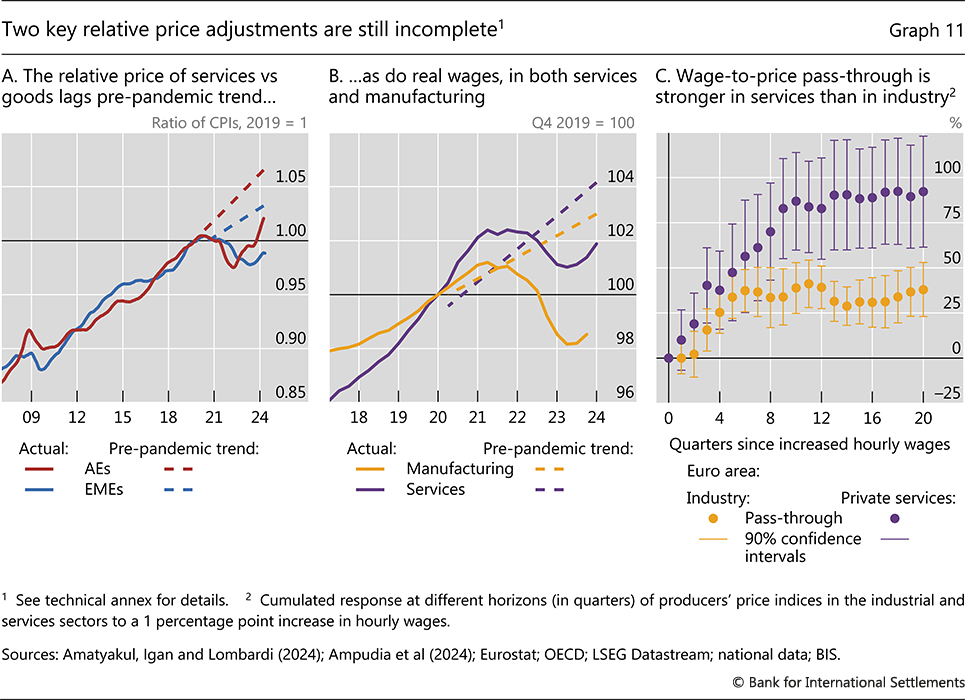
The first relative price adjustment is that of core goods versus services. The powerful pandemic-induced sectoral shifts in demand interrupted the decades-long entrenched trend of services prices outpacing core goods prices (Graph 11.A).5 The initial plunge in the relative price of services vis-à-vis core goods has partly unwound following the resolution of supply disruptions and the fall in commodity prices. Indeed, most of the recent disinflation has been driven by goods prices; services inflation has proven more stubborn, and its contribution to overall inflation has increased.
Despite the recent unwinding, the relative price of services vis-à-vis goods remains below the pre-pandemic trend in most economies, and a further adjustment is likely. The price of services vis-à-vis core goods in EMEs is still well below its 2019 pre-pandemic ratio, while it has just recently crossed it in AEs. In both cases, the relative price remains below the previous trend. Unless the pandemic-induced disruptions have permanently altered preferences or productivity patterns, the upward trend in the relative price would re-establish itself. If lower core goods price growth does not compensate for the shortfall, the upward pressure on inflation could be sizeable (see scenario 1 below).
There are signs that are consistent with this risk. Demand for services has been growing more strongly than that for goods in many economies – an indication that consumers are reverting to pre-pandemic preferences. Input – most notably labour – cost pressures also remain more pronounced for services. Admittedly, core goods price growth could slow further, including owing to developments in China (Box A). That said, goods price increases could gather pace at some point, given the indications of greater fragmentation in the global economy.
The second relative price adjustment is that of labour versus consumer goods and services, ie real wages. As inflation surged, real wages plummeted across most jurisdictions, and have yet to recover despite robust labour markets (Graph 11.B). The catch-up may take time and be less than complete if workers' bargaining power remains as limited as it was before the pandemic.6 Even so, there is a risk that sustained robust conditions in labour markets lead to persistent wage demands in excess of growth in productivity. And since terms of trade effects have largely dissipated, there is no obvious reason why real wages should not catch up. These pressures could remain in the pipeline even after inflation subsides, especially in jurisdictions where wage bargaining is more centralised and staggered. If the purchasing power lost in the recent inflation burst were recouped in the coming years, there could be significant upward pressure on inflation (see scenario 1 below).
The risks are related because services are more labour-intensive than goods. This is one reason why price growth in the services sector generally tends to be more persistent. It also helps to explain why the pass-through from wages to prices tends to be higher in that sector. For example, estimates based on the euro area suggest that the pass-through is twice as large in the private services sector than in industrial sectors. Moreover, the lags are significant, about two to three years (Graph 11.C).7
In addition to the incomplete adjustment of relative prices, other pressure points are noteworthy.
Rather mechanically, the withdrawal or expiration of support measures could unleash new short-term price increases. In particular, fuel subsidies are still substantially above pre-pandemic levels, highlighting the significant role of fiscal policy in containing living costs. Lifting the subsidies is essential, both from a fiscal sustainability point of view and to avoid medium-term inflationary pressures. But, as was clear from the outset, dismantling them will have short-term costs in terms of inflation and make the disinflation journey bumpier.
In addition, further disruptive supply side shocks cannot be ruled out, particularly in the current geopolitical environment. Tensions could flare up and have a significant impact on commodity prices in particular. After a long period of inflation well above target, further shocks would be more likely to threaten a shift to a high-inflation regime, as behaviour adjusts to the recent more inflationary experience.
Macro-financial pressure points
Although the financial system has been resilient so far, macro-financial imbalances could unwind and cause headwinds due to historically high levels of debt and debt service costs. As the impact of pandemic-era loan assistance programmes fades, some households and businesses might find themselves in a precarious position. The cumulative effects of policy tightening could then carry momentum.
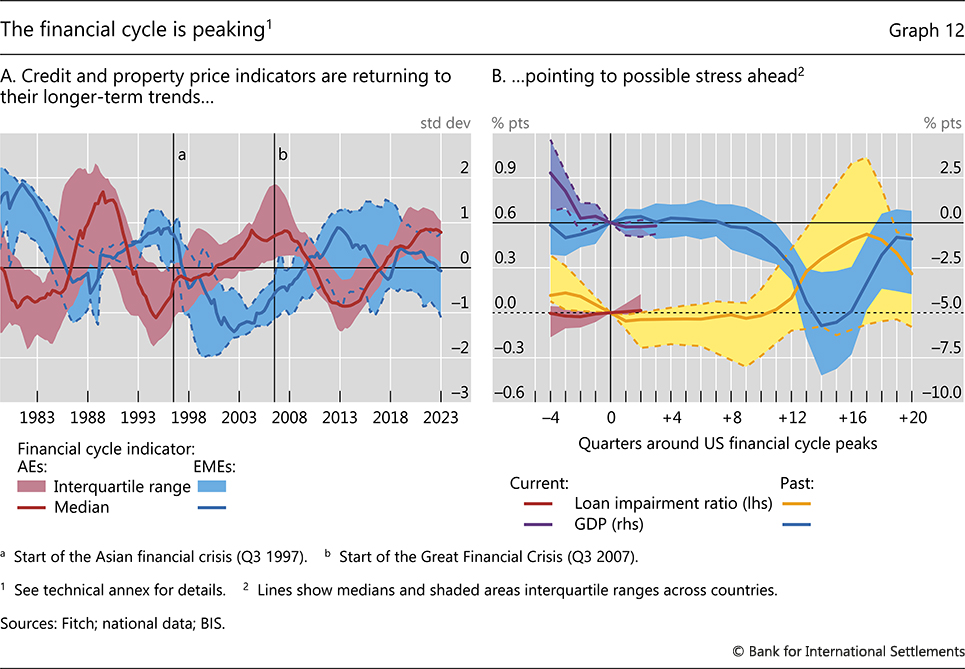
Indeed, particularly in AEs, there are signs that the financial cycle has peaked, as credit indicators and real property prices start returning to their longer-term trends (Graph 12.A). Typically, this is a harbinger of credit losses ahead and weaker economic activity.8 Historically, financial stress tends to show up within two to three years following the first rate hike, as loan impairment ratios rise and economic activity weakens (Graph 12.B, yellow and blue lines, respectively).9 The current cycle is still in very early stages of the post-peak phase (red and purple lines). This historical comparison suggests that it is typical for stress to emerge only with a lag. The risk is higher the longer interest rates stay up, putting pressure on borrowers that need to refinance their debts, especially once the pandemic support that kept defaults artificially low fades.
Within this broad picture, several pressure points merit particular attention.
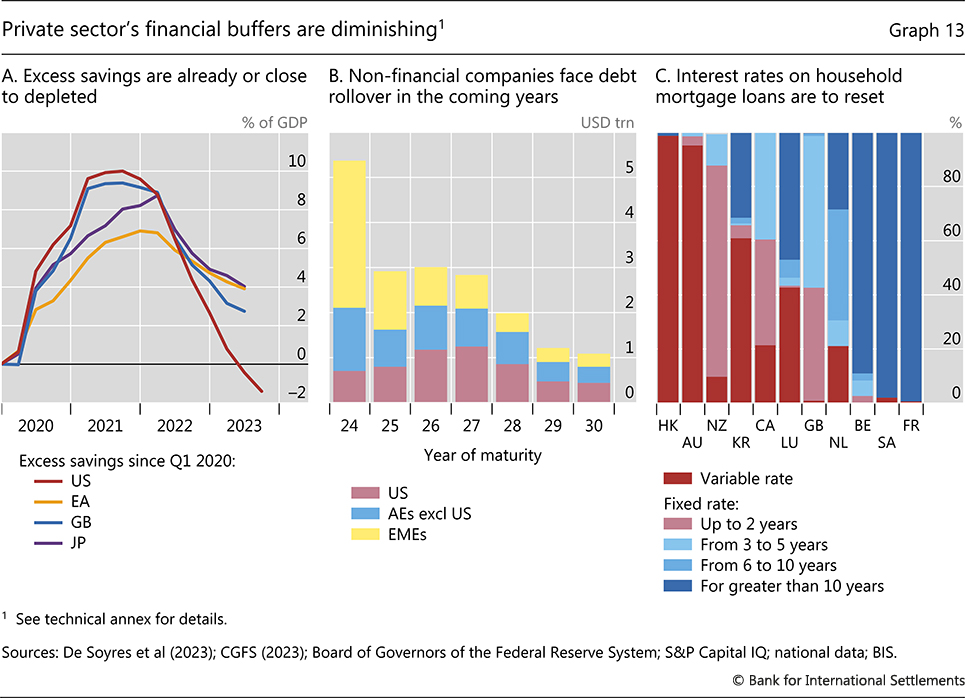
First, deteriorating balance sheets in the non-financial sector and dwindling savings buffers could cause domestic demand to falter. Even for those households benefiting from large fiscal support, excess savings have run out or diminished substantially (Graph 13.A).10 As maturity walls are hit (Graphs 13.B and 13.C), the need to roll over debt at higher interest rates could further dent the financial buffers of households and firms. The cumulative effects of past monetary tightening could generate a materially stronger contractionary effect on domestic demand than seen in the last few years.
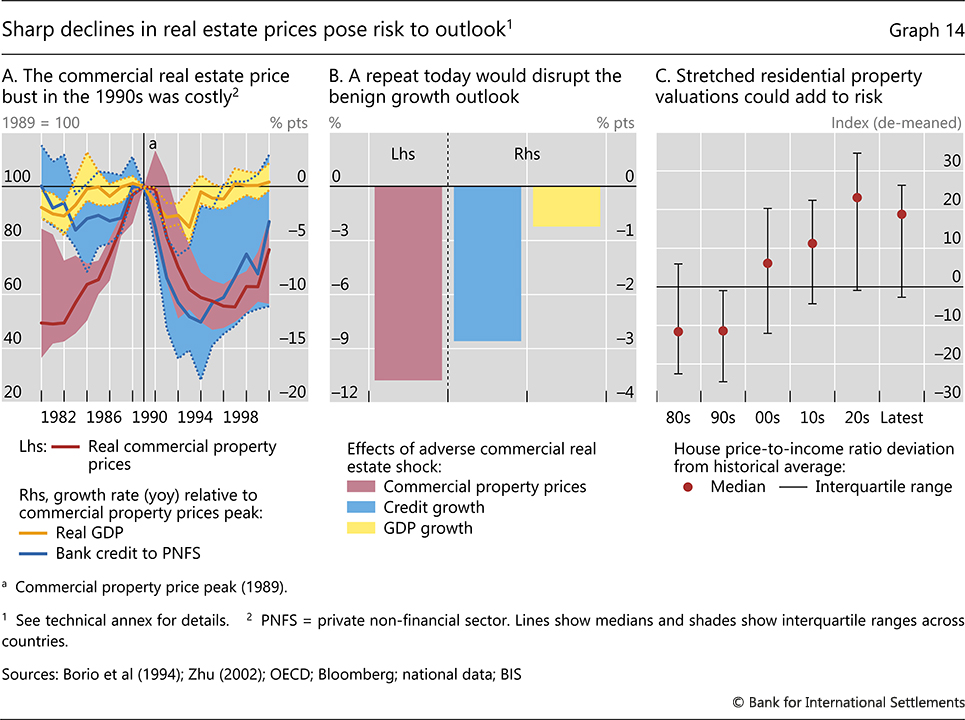
Second, and more specifically, commercial real estate (CRE) is facing both cyclical and structural headwinds (Box C). CRE bankruptcies could impact banks' lending capacity and overall financial health. Signs of possible future stress in the sector appeared initially in 2023, with losses on US CRE exposures crystallising in the books of a few US regional banks and banks elsewhere. Major banks have also reportedly started increasing provisions in anticipation of future losses. So far, the banking system has proved resilient, but vulnerabilities could become evident if exposures to CRE are underreported and if prices drop more than expected.
The macro-financial impact of a large CRE correction could be significant. In the 1990s, when CRE prices fell by over 40% in real terms, credit and GDP growth dropped by 12 and 4 percentage points, respectively (Graph 14.A). An econometric estimate of macro-financial responses to CRE price shocks suggests a sharp fall in CRE prices this time could have a similarly material impact on credit and GDP growth (Graph 14.B). While naturally uncertain, these estimates highlight the possible repercussions of a CRE bust. And the impact could be amplified by credit losses or a broader drop in other asset prices. Indeed, the risk of such a drop looms large for the residential segment of real estate markets, where house price valuations continue to be very stretched relative to in the past (Graph 14.C).
Third, nonbank financial intermediation merits close monitoring. In particular, private credit and equity markets have grown exponentially in the post-Great Financial Crisis (GFC) years of cheap financing (Box D).11 This has increased their vulnerability to higher interest rates. Despite the recent drop in credit spreads, the gap between those in the riskiest and those in other loan segments has increased (Graph 15.A), highlighting pockets of vulnerability. Opaque valuations and infrequent updates of these valuations might create a lagged reaction of private markets to a potential correction in public markets. A correction in private equity and credit could spark broader financial stress via at least three channels. First, investors might liquidate assets elsewhere, potentially transmitting the shock to other market segments. Insurance companies could be quite vulnerable given their increased exposure to private credit (Box E). Second, firms that tap the market could find themselves squeezed, generating spillovers on their clients and the economy. Third, banks remain exposed to the sector, either directly or indirectly, not least as ultimate providers of liquidity.
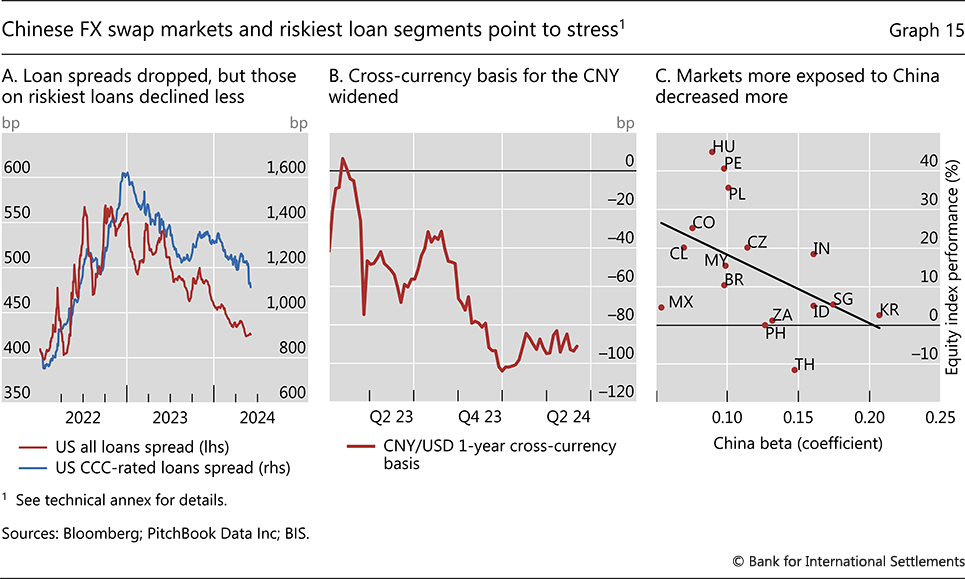
Finally, a slowdown in the Chinese economy and troubles in its financial sector, particularly related to real estate, could spill over globally. The falling equity market and capital outflow pressures were reflected in various indicators, including a widening cross-currency basis (Graph 15.B), which sent some warning signs about the state of the economy. And while policy support has provided an important backstop, it has come at the cost of larger fiscal deficits and a build-up in government debt. A financially induced downturn in China could have a broader impact on market sentiment elsewhere, especially for EMEs closely related to China (Graph 15.C). AE banks exposed to the Chinese real estate sector could also find themselves struggling.
Fiscal pressure points
Expansionary fiscal policies could become a source of tension, with implications for inflation and macro-financial balances. As one possibility, an extended or renewed fiscal expansion could over-stimulate demand and complicate the disinflation task during the last mile.12 The risk is especially high in a year of many elections such as this one. Another related possibility is that fiscal sustainability concerns come to the fore and create headwinds through higher risk premia and financial market dysfunction. As discussed in last year's Annual Economic Report, debt trajectories are a major concern globally going forward (Graph 16.A).
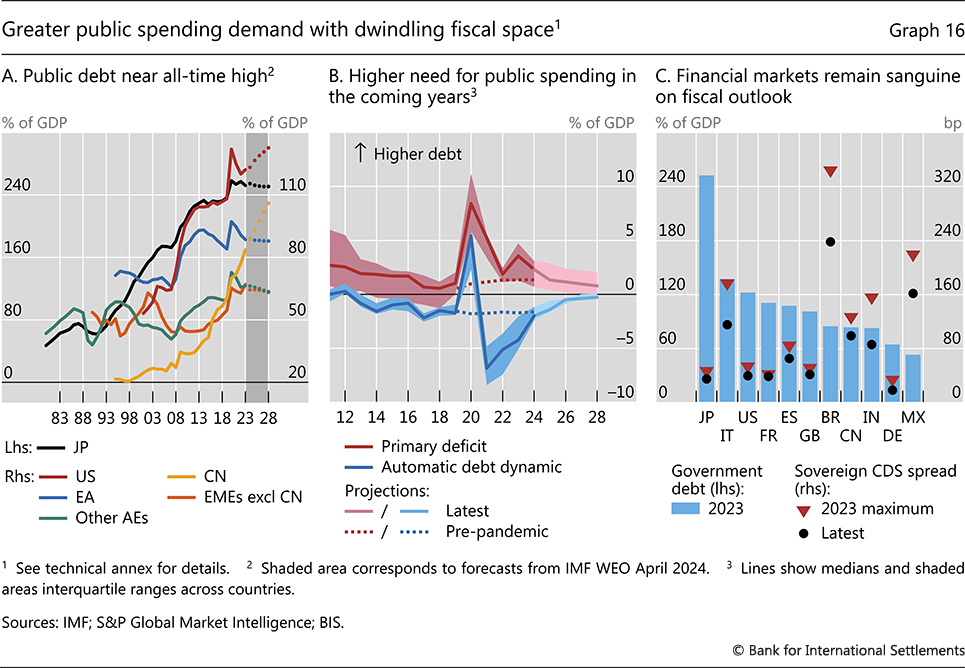
The environment of higher interest rates further weakens fiscal positions that are already stretched by historically high debt levels. Indeed, the support from the negative gap between real interest rates and growth rates (that is, r–g) has shrunk in recent years, is projected to stay much smaller going forward and could even turn positive (Graph 16.B, blue line). Curbing fiscal space further is rising public spending in the coming years (Graph 16.B, red line), given the needs stemming from the green transition, pensions and healthcare, and defence. Though financial market pricing points to only a small likelihood of public finance stress at present (Graph 16.C), confidence could quickly crumble if economic momentum weakens and an urgent need for public spending arises on both structural and cyclical fronts. Government bond markets would be hit first, but the strains could spread more broadly, as they have in the past.
Productivity pressure points
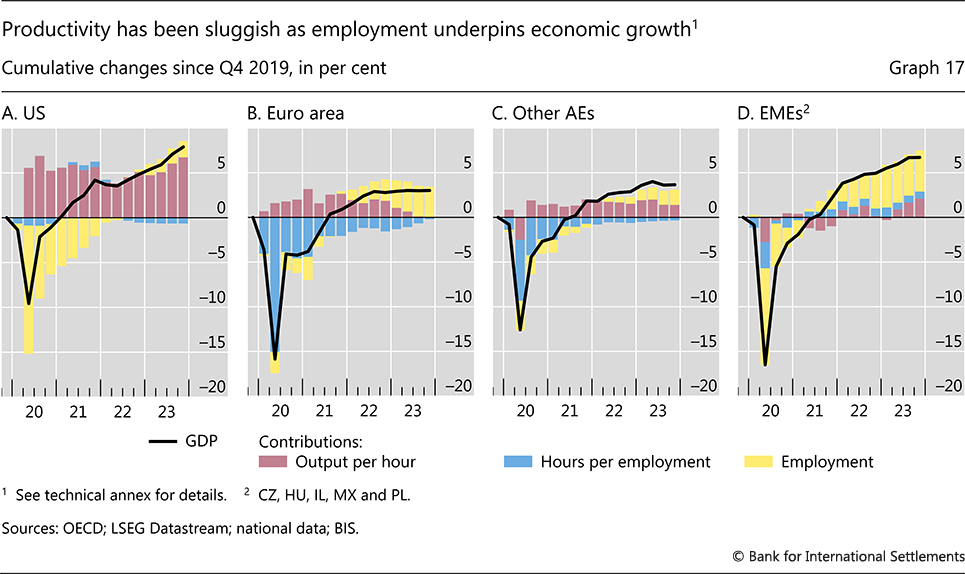
Lacklustre productivity growth could be longer-lasting than previously thought. With few exceptions – notably the United States – productivity growth has generally been subdued since the pandemic, as employment held up growth (Graph 17). In the near term, the effects of the pandemic on productivity could linger for longer than expected, for example if strong demand for services continues to support employment in parts of the economy that have a lower level of productivity. This could keep overall labour productivity growth subdued (red bars), as has been the case especially in the euro area, even as hours per worker normalise (blue bars).
Indeed, while distinguishing cyclical from secular forces is not easy, slow trend productivity growth was already a concern pre-pandemic, not least owing to flagging structural reforms. Together with unfavourable demographic trends, slow productivity growth would weigh on potential growth.13 One symptom of these headwinds is that, for most economies, GDP growth rates have remained moderate, similar to pre-pandemic averages, and in some cases, they have slowed further (Graph 18.A). Lower productivity growth would add to inflationary pressures, reduce the headroom for both monetary and fiscal policy and, more generally, widen the gap between society's expectations and policymakers' capacity to meet them, making any adjustments much harder.
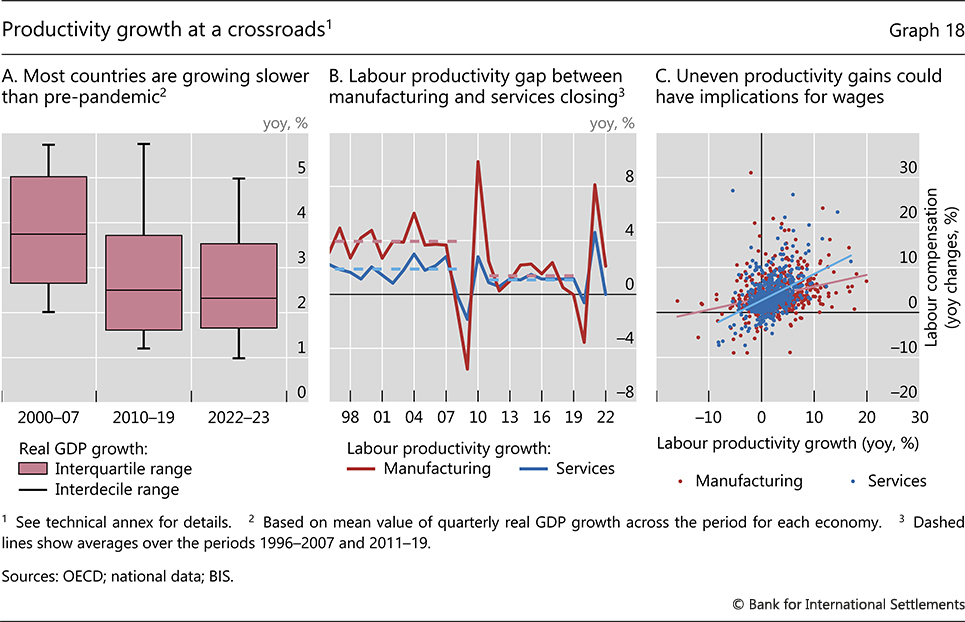
Could ongoing technological progress help counteract these growth headwinds, powered by greater use of remote work technologies, digitalisation and artificial intelligence (Chapter III)? Possibly. But even so, these would likely generate uneven benefits across sectors and countries.14 The services sector arguably stands to gain the most from these technologies. As a result, the gap in labour productivity growth between the services and manufacturing sectors, which has already been narrowing since the mid-1990s, could close or even reverse (Graph 18.B). This could weigh on less diversified economies heavily reliant on manufacturing activities, particularly if they are slow to adapt to skills- and sector-biased technological advances.
A technology-driven productivity rotation could also have implications for price and wage dynamics over the longer term. One possibility is that relatively stronger productivity gains in the services sector pave the way for lower relative prices for services, as was the case for the manufacturing sector in past decades. If so, the inflation impact could be benign. Another possibility is that higher labour productivity allows services wages to increase. Indeed, there appears to be a stronger link between nominal wages and productivity in the services sector than in the manufacturing sector (Graph 18.C). In this case, broader wage pressures could ensue due to labour competition: goods-producing firms may need to bid up wages to prevent workers from leaving to the services sector. This could result in higher inflation.
Turbulence scenarios and policy implications
Turbulence scenarios
Inflation has continued to ease, and a smooth landing is within sight. Under this central scenario, inflation will come down further in the period ahead to be consistent with central bank targets. As economic growth stabilises around the medium-term trend, the associated weakening of labour markets is expected to be modest, with outcomes that, from a historical perspective, look benign.
That said, risks on the horizon could push economies off course. Constellations of pressure points could come together to produce destabilising outcomes. Two plausible alternative scenarios, spanning a wide range of possibilities, illustrate pertinent policy trade-offs and challenges.
Scenario 1: inflation resurgence
In the first scenario, inflation pushes higher again. This could arise most obviously from inflation pressure points giving way, whether from persistent relative price adjustments or adverse supply shocks (eg geopolitical events leading to an abrupt surge in commodity prices). Other pressure points could also increase the likelihood of this scenario or even instigate it, for example if fiscal policy turns overly expansionary, overall productivity growth disappoints or sectoral productivity developments push up wages. For small open economies, the additional trigger could be a sharp exchange rate depreciation, prompted by core AEs' anticipated monetary policy response to stickier inflation, deteriorating inflation expectations or financial tensions giving rise to capital outflows.
The upward pressure on inflation from relative price adjustments alone could be sizeable. For illustrative purposes, consider the price adjustments that would be needed to restore the pre-pandemic relative price trend between core goods and services by the end of 2026. If core goods prices grow at the pre-pandemic average rate, then services price growth would need to be 1 percentage point higher than its historical norm, on average. With services accounting for around 50% of total consumption, this would mean that the overall rate of inflation would be around 0.5 percentage points higher than otherwise (Graph 19.A). For some countries, the increase in services price growth to restore the pre-pandemic relative price trend could be as large as 3 percentage points, implying overall inflation would be up to 1.5 percentage points higher than otherwise. And if core goods inflation is higher at 2%, for example due to diminishing tailwinds from cheap imports, overall inflation could increase by 1–2 percentage points on average for most countries. To prevent such a scenario from materialising, central banks would need to take further action.
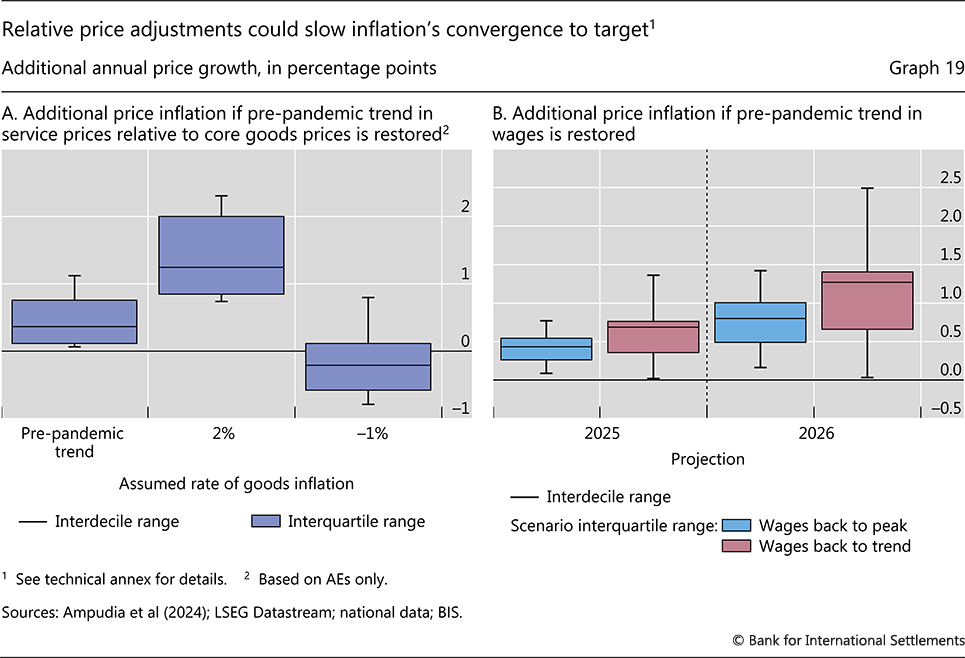
Real wages are another relative price that could materially add to inflationary pressures. To recoup the purchasing power lost due to the recent inflation wave, growth in nominal wages would need to outpace prices. This could put pressure on firms to pass on higher production costs to protect their margins, leading to higher inflation. Empirical estimates suggest that such pressures could materialise over roughly two and a half years for services and one and a half years for goods and they could be stronger in services (Graph 11.C above). All else equal, recouping the purchasing power lost since mid-2021 could add up to 0.75 percentage points to inflation in 2025 and up to 1.5 percentage points in 2026 (Graph 19.B, blue boxes). If wages were to grow even faster and catch up with their pre-pandemic trend, this could add up to 1.5 percentage points to inflation in 2025 and over 2.5 percentage points in 2026 (red boxes). In this case too, central banks would need to take further action to avert the scenario.
These calculations preclude the possibility of a full-blown wage-price spiral. As the pass-through of wages to prices is partial, these calculations assume some compression of profit margins that allows for wage growth to make up for the lost purchasing power. But it is plausible that, with marked increases in wages, firms could attempt to protect their margins and increasingly pass on the costs, thereby reinforcing the wage-price feedback loop. Estimates from a joint model of wages and consumer prices underline this two-way interaction, as shortfalls of wages from their long-run relationship with prices tend to feed back into prices, and vice-versa.15 Estimates also show that wages and consumer prices chase each other with greater intensity as inflation rises.
The extent of these relative price adjustments, in combination with how other pressure points play out, would dictate the characteristics of an inflation resurgence.
One possibility is that multiple forces align to produce a strong inflation burst. For instance, the initial shocks, even if short-lived, could be amplified by key relative price adjustments to produce concentrated effects on highly salient prices for households and firms. Further fiscal support for households and firms would make the inflationary impact larger and more enduring. The second-round effects, more likely to materialise in this case, could be more difficult to contain given the context of high inflation over the last few years. The urgency of re-establishing the credibility of inflation targets would regain prominence.
In another variant of this scenario, disinflation stalls and inflation hovers stubbornly above target even in the absence of large shocks. Key drivers could be persistent pressures from relative price adjustments and productivity developments. While the immediate impact on inflation may be smaller than in the first variant and relative price adjustment would be complete at some point, if inflation stays above target for long, the behavioural norms of workers and firms could change permanently. The feedback between wages and prices would then entrench higher inflation.
The inflationary scenario, especially the more virulent variant, would, in turn, represent a major threat to financial stability. Interest rates would go higher for longer, weighing heavily on financial conditions, economic agents' balance sheets and ultimately economic activity (see below).
Scenario 2: hard landing
In the second scenario, inflation continues to ease as anticipated, but growth deteriorates sharply. The culprits could be some combination of real and financial tensions reaching a point of fracture, possibly amplifying one another. With private sector balance sheet buffers running out, fiscal sustainability attracting focus, or stresses emerging in key segments of the financial markets, growth could lose momentum. Much weaker economic activity would undermine the strength of the labour market, the linchpin of the economy, precipitating the hard landing that policymakers have so far taken great care to avoid.
A hard landing could generate strains on the financial system even in the absence of any policy tightening. Most immediate would be a further tightening of financial conditions, with wider risk spreads and a sell-off of global risky assets. More frequent bouts of market dysfunction could ensue, adding to stress for financial institutions and investors. Tighter financial conditions and retrenchment in credit supply could, in turn, accelerate the depletion of borrowers' financial buffers, possibly impairing credit quality. A hard landing would entail both demand headwinds and heightened financial stability risks.
A hard-landing scenario could furthermore mask the role of secular supply-side developments taking place concurrently. The effects of any productivity slowdown or developments of other structural factors on growth would be all but concealed in the midst of strong demand headwinds. Determining the degree of economic slack would be even more challenging.
Policy implications
Guiding considerations
Any policy prescription depends on the balance of risks to the outlook. Although risks will vary across economies, some general considerations, informed by the lessons from recent decades, could help guide policy (see also Chapter II).
First, policies adopted today need to be robust to key risks on the horizon. In the spirit of robust control theory, the policy stance should deliver reasonable outcomes in a broad range of conceivable scenarios.
Second, in addressing near-term challenges, policymakers should be cognisant of any longer-term costs or side effects of their policy actions. Often, these costs may become evident only in the longer term, giving rise to intertemporal trade-offs that must be taken into consideration. Complementary policies, such as macroprudential measures and, where appropriate, foreign exchange interventions, can be used to mitigate these costs or side effects.
Third, and in the same spirit, policies should explicitly consider the importance of having sufficient safety margins or room for manoeuvre. This would bolster resilience by allowing policies to deal more effectively with the future materialisation of risks.
What do these considerations suggest for current policy settings? How could policymakers best navigate the risks of an inflation resurgence, on the one hand, and a hard landing, on the other?
Monetary policy
The primacy of price stability as a pre-condition for sustainable growth cautions against a rapid and substantial easing of policy. Policy rates will need to stay high for as long as needed to re-establish price stability. A premature easing could reignite inflationary pressures and force a costly policy reversal – all the costlier because credibility would be undermined.16 Indeed, risks of de-anchored inflation expectations have not gone away, as pressure points remain. Macroeconomic and financial stability would be most vulnerable in this event. To guard against it, monetary policy needs to prioritise a sustainable return of inflation to target.
The need to preserve some policy space further underscores the case for a cautious policy approach. Stop-and-go policies should be avoided, as they could weaken central banks' abilities to address resurgent inflation. Most central banks have now regained the room for policy manoeuvre to face possible downturns – a silver lining from the recent flare-up of inflation and consistent with some goals of monetary policy framework reviews (Chapter II). In this sense, setting a high bar for policy easing is reasonably robust to the two adverse scenarios: it hedges against an inflation resurgence, and it provides room for manoeuvre in the event of a hard landing.
Conserving policy space also calls for a circumspect assessment of what is sometimes seen as determining the end point for interest rates (or "terminal rate"). This is technically known as the natural rate of interest or r-star (Chapter II). As the available evidence is inconclusive,17 it would be highly imprudent to conclude that real interest rates must inevitably gravitate towards the ultra-low levels seen in the decade prior to the pandemic based on the view that these were necessarily equilibrium rates produced by deep-seated structural forces. There is simply too much uncertainty about the determinants of such equilibrium rates and their level at any given point in time. The cautious approach to policy easing would be robust to r-star uncertainty as well.
A cautious easing approach would also be consistent with central banks striking a good balance between keeping near-term macro-financial stresses at bay and promoting a less leveraged and more stable financial system in the longer term. Admittedly, easing monetary policy quickly at the sign of lower inflation may help pre-empt financial stresses and improve the prospect of a smooth landing in the very near term. But it could also fuel financial risk-taking and contribute to the build-up of financial imbalances down the road. The juncture offers a rare window of opportunity to wean economies off the long-standing dependence of growth on monetary policy and to lessen the likelihood of another era of low-for-long interest rates.
EMEs and small open economies can make their cautious easing approach more robust by judiciously deploying foreign exchange intervention, where necessary and appropriate, to shield against destabilising external developments. The pressure to do so could build as macroeconomic outlooks diverge across economies and interest rate differentials widen. On the bright side, many central banks today are better positioned to manage these external risks. Stronger policy frameworks, underpinned by central bank independence and foreign exchange reserve buffers, lessen the scope for sudden capital flight or runaway exchange rate depreciation. At the same time, there are limits to what foreign exchange intervention can achieve. It is no substitute for necessary macroeconomic adjustments and sound monetary and fiscal policy settings. A guiding consideration is to deploy foreign exchange intervention as a complementary tool akin in orientation to macroprudential ones (Chapter II).
Prudential policy
Prudential policy must remain vigilant and continue to strengthen the soundness of the financial system. The resilience of the system so far is in no small measure because of improvements in its loss-absorption capacity and governance. But it also reflects a surprisingly buoyant real sector. That resilience should not be taken for granted, especially as the economy could slow more than expected and asset price adjustments need to run their course. So far, the strains that have appeared have reflected mainly the materialisation of interest rate risk; credit losses are still largely to come.
It is crucial to avoid a premature easing of macroprudential policies. The evidence strongly indicates that tightening macroprudential measures can help reduce the likelihood of financial stress even once the monetary policy tightening phase is under way (Chapter II). Measures should be relaxed, releasing buffers if and only when signs of stress emerge: the measures are designed to address the financial cycle and financial stability, not shorter-term economic fluctuations as such. Beyond that, their adjustment will naturally depend on country-specific circumstances, as the cycles are not synchronised internationally and the impact of global financial conditions on individual jurisdictions varies.
At the microprudential level, there is need for action on two fronts. From a more conjunctural perspective, authorities need to stand ready to take prompt and preventive measures to minimise the likelihood of the emergence of stress. Tight supervisory scrutiny is of the essence. From a longer-term perspective, the priority is to continue to implement the agreed reforms to further enhance the resilience of the system. This includes the timely, full and consistent implementation of Basel III. It also involves further efforts to implement the agenda concerning recovery and resolution mechanisms and to strengthen the regulation of non-bank financial institutions (NBFIs) from a systemic (macroprudential) perspective.18
Strengthening the macroprudential regulation of the NBFI sector has met with significant difficulties. This applies, in particular, to some forms of asset management and private credit, where hidden leverage and liquidity mismatches are prevalent. Efforts have been under way since the GFC at both national and international levels. But the results have been modest so far. Making substantial progress may require more incisive steps, not least to include financial stability as an explicit objective in the mandate of securities regulators.
Fiscal policy
For fiscal policy, consolidation is an absolute priority. In the near term, this would help relieve pressure on inflation and lessen the need to keep interest rates high, in turn helping to preserve financial stability. The higher fiscal burdens under the inflation resurgence or hard landing scenarios further argue for consolidation to conserve near-term policy space. Meanwhile, in the longer term, the urgency to consolidate continues to grow given the historically high debt and the outlook for higher interest rates.19
The window of opportunity to take decisive action is narrowing. For example, as of last year, AEs would have needed to keep budget deficits below 1.6% of GDP to stabilise public debt; today, that number is 1% of GDP.20 And the room for fiscal policy manoeuvre is rapidly shrinking. Looming ahead are much larger spending needs related to healthcare and pensions – given demographic trends – and the green transition and defence – considering the geopolitical landscape.
Multi-pronged consolidation strategies are called for, with an emphasis tailored to country-specific circumstances.
On the expenditure side, it is important to scale back discretionary measures, by terminating those enacted during the pandemic and refraining from new fiscal stimulus in the absence of compelling macroeconomic justifications. More ambitiously, there is a need to press ahead with social spending reform to better align fiscal obligations with fiscal sustainability. Prioritising growth-enhancing spending, for example on the green transition, human capital and structural reforms, would also help improve efficiency as long as that spending is executed effectively. Bringing in private capital to help meet long-term objectives could create additional policy space.
On the income side, governments need to strengthen revenue mobilisation further by expediting tax reforms and broadening tax bases. For example, the implementation of a minimum corporate tax rate for large multinational companies is a welcome step in that direction. In EMEs, where the informal sector tends to be larger and tax bases smaller, stronger enforcement and simpler tax codes would help increase revenue collection.
Structural policies
Last but not least, and considering the limited scope of monetary and fiscal policies to boost potential output, structural policies need to play a crucial role in promoting sustainable growth.21 Only structural policies can strengthen the supply side of the economy, which holds the key to long-run economic well-being. Informed by recent experience, policymakers should recognise the importance of enhancing not only the level but also the resilience of growth. Stepping up structural reforms has gained particular urgency given the rapid global shifts on multiple fronts, ranging from technology to the green transition and to global trade. With so much at stake, delaying and falling short is a luxury no country can afford.
Structural reforms should aim to create an environment in which supply-side forces can play their full role. This means promoting competition, enhancing labour and product market flexibility, and spurring innovation. It also means a judicious deployment of scarce public funds to support the economy's adjustment to the new realities. In all this, there is also room for international dialogue to forge consensus on blueprints and best practices, not least in response to emerging priorities such as climate change and artificial intelligence. After all, these pose common challenges to humanity, and overcoming them will benefit everyone.
Endnotes
1 See Doornik et al (2023).
2 See Hardy et al (2024).
3 See Shapiro (2022).
4 See Miranda-Pinto et al (2023).
5 The long-run trend reflects the confluence of several factors. First, a higher income elasticity of services: as income per capita rises, so does the relative demand for services and hence their relative price. Second, in what is commonly known as the Baumol cost disease, the services sector competes for labour with the higher-productivity manufacturing sector and, given the need to offer similar wages, must charge higher relative prices to compensate for the productivity gap. Third, international competition has a more pronounced effect on prices of goods than those of services.
6 See Borio et al (2023).
7 See Ampudia et al (2024); similar results for the United States are documented by Heise et al (2022).
8 See Borio et al (2019). The financial cycle indicator uses bandpass filters with frequencies from eight to 32 years to extract medium-term cyclical fluctuations in the log-level of inflation-adjusted credit, the credit-to-GDP ratio and real property prices.
9 See also Borio (2014).
10 See also de Soyres et al (2023).
11 Private equity investing involves taking an ownership stake in a company that is not currently traded on public markets. Private credit typically refers to lending by non-bank financial institutions that are often highly leveraged and cannot borrow in corporate bond markets. See Box D for further information.
12 See also BIS (2023).
13 Inefficient resource allocations, in addition to macroeconomic factors, could also contribute to weak productivity. See IMF (2024a, Chapter 3) and Andrews et al (2015).
14 Acemoglu (2024) argues that artificial intelligence advances may generate only a modest boost to total factor productivity, only 0.5–0.7% over 10 years, while increasing inequality and widening the gap between capital and labour incomes. Meanwhile, Brynjolfsson et al (2023) show in an experimental setting that the use of generative AI tools in a customer service context could boost productivity by 14% on average.
15 See BIS (2023).
16 Policy credibility is a key part of trust in public policy, which, once lost, can be difficult to regain. See Carstens (2024).
17 See Benigno et al (2024).
18 See BIS (2023) for more in-depth discussion.
19 See IMF (2024b).
20 Average primary deficits required to keep the ratio of public debt to GDP constant over the next five years. Median of CA, DE, FR, IT, GB, JP and US, as of April 2023 and April 2024. See also the footnote to Graph 16 for methodology and assumptions.
21 See OECD (2023).
Technical annex
Graph 2.A: Based on Okun's law, which describes a stable negative relationship between changes in output and changes in unemployment. Actual and predicted show the average unemployment rate between Q1 2022 and Q4 2023, where predicted outcomes are based on a linear regression model fitted from Q1 2000 and Q4 2019, subject to data availability.
Graph 2.B: AEs = AU, CA, EA, GB, JP and US.
Graph 2.C: Median values across NFC per country. For the regions, GDP-PPP weighted averages of the 20 EA member states, six other AEs, nine Asian EMEs and six Latin American economies. EA = AT, BE, CY, DE, EE, ES, FI, FR, GR, HR, IE, IT, LT, LU, LV, MT, NL, PT, SI and SK. Other AEs = AU, CH, GB, NO, NZ and SE. Asian EMEs = HK, ID, IN, KR, MY, PH, SG, TH and VN. Latin America = AR, BR, CL, CO, MX and PE.
Graph 4.A: Based on yearly averages. GDP-PPP weighted averages for: AEs = CA, CH, DK, EA, GB, JP, NO, SE and US; EMEs = BR, CL, CO, CZ, HU, IL, KR, MX, PH, PL, SG and ZA.
Graph 4.C: Other AEs = AU, CA, DK, GB, NO, NZ and SE; GDP-PPP weighted averages.
Graph 5.A: Based on sectoral personal consumption expenditures data up to Q3 2023, except for NL and SE up to Q4 2023.
Graphs 5.B: Based on a linear regression model fitted from Q4 2000 to Q3 2022. Annualised quarter-on-quarter headline inflation is regressed on its own lag, job vacancy rate, oil price (West Texas Intermediate), Federal Reserve Bank of New York Global Supply Chain Pressure Index, Federal Reserve Bank of Cleveland estimates of one-year-ahead inflation expectations and output gap. The contributions are computed based on the year-on-year changes.
Graph 5.C: Cyclical sensitivity is measured based on estimates for AU, CA, DE, ES, FR, GB, IT, JP, KR and US since 1990, upon data availability, obtained by regressing sectoral inflation on its fourth lag and the output gap. Change in price growth corresponds to the change in year-on-year inflation from peak to latest (Q1 2024). For US, peak as of Q2 2022; for EA, as of Q1 2023. Euro area disinflation corresponds to the simple average across DE, ES, FR and IT.
Graph 6.C: Historical = GDP-PPP weighted average price-to-earnings ratios from 2 January 2010 until 31 May 2024. Latest = 31 May 2024. AEs = AU, CA, CH, EA, GB, JP and NZ. EMEs BR, CL, CN, CO, CZ, HK, HU, ID, KR, MX, MY, PE, PH, PL, SG, TH and ZA. For major tech firms (Alphabet, Amazon, Apple, Meta, Microsoft, Nvidia and Tesla), the median is shown.
Graph 7.A: Showing option-adjusted spread, the yield spread over a benchmark yield curve adjusted for the value of embedded options.
Graph 7.B: Revisions to the federal funds rate expected to prevail at the end of the next calendar year from the perspectives of the Federal Reserve and the financial market (vertical axis), against the three-month moving average of the Bloomberg inflation surprise index (horizontal axis). June 2021–June 2024.
Graph 7.C: Weekly average for federal funds rate futures.
Graph 8.A: Goldman Sachs Financial Conditions Index (FCI): a weighted average of country-specific risk-free interest rates (both long- and short-term), exchange rates, equity valuations and credit spreads, with weights that correspond to the estimated impact of each variable on GDP. A value of 100 indicates average conditions. A higher (lower) value indicates tighter (looser) conditions.
Graph 8.B: Monthly averages. VIX = Chicago Board Options Exchange (CBOE) Volatility Index. VXTLT = CBOE 20+ Year Treasury Bond ETF Volatility Index.
Graph 8.C: GDP-PPP weighted averages for countries in the region. Asian EMEs = CN, ID, IN, KR, MY, PH, SG, TH and VN; Latin America = BR, CL, CO, MX and PE; other AEs = AU, CA, CH, EA, GB, NO, NZ and SE; other EMEs = CZ, DZ, HU, IL, KW, PL, RO and ZA.
Graph 9.A: Net percentage of bank loan officers reporting they are tightening lending standards.
Graph 9.B: Net percentage of bank loan officers reporting they are seeing increased loan demand.
Graph 10.A: Simple averages of the price-to-book ratio are calculated from the aggregates of country-specific constituents for EA, other AEs and EMEs. EA = AT, BE, DE, ES, FI, FR, IT and NL. Other AEs = AU, CA, CH, DK, GB, JP, NO, NZ and SE. EMEs = AE, AR, BR, CL, CN, CO, CZ, HU, ID, IN, KR, MX, MY, PE, PH, PL, SA, SG, TH, TR and ZA.
Graph 10.B: For EME gov yield, JPMorgan GBI-EM broad traded index. For EMBI spread, JPMorgan Emerging Market Bond Index. For EME portfolio flows, EPFR net equity and bond fund flows. End of the cycle is defined as the month prior to the first policy rate cut; Mar 2024 is treated as the end of the current cycle. FX rate is calculated as GDP-PPP weighted averages of the bilateral exchange rates of EMEs against the US dollar; an increase indicates an appreciation of the dollar. Equities calculated as the equally weighted average of broad local currency equity market indices of EMEs. For episodes in 1980–90s, simple averages across selected past US tightening cycles starting in: Mar 1983, Mar 1988, Feb 1994 and Jun 1999. Data are available for EMBI spread since 1991, equities since 1992, EME gov yields since 2002 and EME portfolio flows since 2003. EMEs = BR, CL, CN, CO, CZ, HU, ID, IN, KR, MX, MY, PH, PL, TH and ZA.
Graph 11.A: GDP-PPP weighted averages of six-month moving averages of seasonally adjusted series. AEs = AU, CA, CH, DK, EA, GB, JP, NO, NZ, SE and US. EMEs = BR, CL, CO, CZ, HU, IL, KR, MX, PE, PH, SG and ZA. Pre-pandemic trend estimates based on Q1 2015–Q4 2019 data.
Graph 11.B: Real wages are computed by deflating nominal wages with headline CPI. National definitions. Four-quarter moving averages. Pre-pandemic trend estimates based on Q1 2013–Q4 2019 data. Sample covers CA, CZ, EA, GB, HU, JP, MX, NO, SE and US.
Graph 11.C: Estimates are based on sectoral data from Eurostat, already aggregated across countries, between Q1 2009 and Q2 2023; for further details, see Ampudia et al (2024).
Graph 12.A: Based on Borio (2014). Financial cycles are measured by frequency-based (bandpass) filters capturing medium-term cycles in real credit, the credit-to-GDP ratio and real house prices. Financial cycles are normalised by country-specific means and standard deviations before simple averages are taken for country groupings. AEs = AU, BE, CA, CH, DE, DK, ES, FI, FR, GB, GR, IE, IT, JP, NL, NO, NZ, PT, SE and US. EMEs = BR, CL, CN, CO, CZ, HK, HU, ID, IL, IN, KR, MX, MY, SG, TH, TR and ZA.
Graph 12.B: Changes relative to the peak of the US financial cycle peaks, identified as Q4 1987, Q3 2005 and Q2 2023. Median across the episodes in AU, BE, BR, CA, CH, CL, CN, CZ, DE, DK, ES, FI, FR, GB, HU, ID, IE, IL, IN, IT, JP, KR, MX, MY, NL, NO, NZ, PT, SE, TH, US and ZA for GDP; and BR, CA, CN, DE, ES, FR, GB, ID, IN, IT, JP, KR, NL, PT, SE, TH and US for loan impairment ratio.
Graph 13.A: Excess savings are defined as savings accumulated when the household savings rate is above trend (based on the Hamilton (2018) filter, which extracts a time-varying trend). Accumulation starts in Q1 2020.
Graph 13.B: Annual data, 2023 if available, 2022 otherwise. EMEs = AR, BR, CL, CN, CO, CZ, HK, HU, ID, IL, IN, KR, KW, MA, MX, MY, PE, PH, PL, RO, SA, SG, TH, TR and ZA. Other AEs = AT, AU, BE, CA, CH, CY, DE, DK, EE, ES, FI, FR, GB, GR, IE, IT, JP, LT, LU, LV, MT, NL, NO, NZ, PT, SE, SI and SK.
Graph 13.C: 2023 or latest available. Definitions vary by country. New mortgages are available for residents of AU, BE, CA, FR, GB, HK, IE, LU, NL and SA. Existing mortgages are offered in KR and NZ. Variable rate corresponds to variable rate and fixed rate mortgages up to three months for KR and LU, and to variable rate and fixed rate up to one year for NL. Fixed rate up to two years corresponds to four months to three years for KR, and from four months to two years for LU. Fixed rate from three to five years corresponds to one to five years for NL. Fixed rate from six to 10 years corresponds to five to 10 years for KR. Fixed rate greater than 10 years corresponds to the duration of the loan for FR and HK.
Graphs 14.A and 14.C: The country sample considered is AU, CA, DE, DK, ES, FI, FR, GB, IT, JP, NL, NO, SE and US.
Graph 14.B: Estimated effects are in deviations from baseline projections, averaged over 2024–26. Estimates are based on a Bayesian VAR model with quarterly US data consisting of GDP growth, real commercial property price growth, real residential property price growth, credit to the non-financial sector growth, debt service ratio for the total private non-financial sector, policy rate and real equity price index returns. Sample covers Q1 1981 to Q3 2023. The commercial property price shock is identified via sign restrictions as one that induces an immediate fall in commercial property prices and credit growth, before generating a decline in GDP growth with a lag.
Graph 14.C: Latest is Q4 2023 for all countries except DK and NL (Q3 2023).
Graph 15.A: Loans considered are leveraged loans. Spreads to maturity.
Graph 15.B: Based on Shanghai interbank offered rate (Shibor) versus secured overnight financing rate (SOFR).
Graph 15.C: Equity index performance: latest relative to 1 June 2023. China beta: linear regression of daily log changes in equity price indices on the Chinese index, controlling for the US index. Regressions estimated between 7 January 2002 and 1 June 2023.
Graph 16.A: IMF projections, based on assumed policy paths, maintaining trends in government debt structure when specific budget information is lacking. Other AEs = AU, CA, CH, GB and SE. Other EMEs = AR, BR, CL, CO, HU, ID, IL, IN, KR, MX, MY, PE, PH, SA, SG, TH, TR and ZA.
Graph 16.B: Automatic debt dynamic is calculated as (rt - gt) X Debtt-1, where rt is a five-year rolling average of 10-year government bond yields (as a proxy for interest payments) adjusted for the annual change in the GDP deflator, and gt is the annual real GDP growth. From 2024 on, 10-year government bond yields are assumed to stay constant. The country sample is CA, DE, FR, GB, JP, KR and US. Projections correspond to IMF calculations, based on assumed policy paths, maintaining trends in government debt structure when specific budget information is lacking.
Graph 16.C: Latest is 31 May 2024. CDS 10-year maturity.
Graph 17: GDP-PPP weighted averages for regions. Euro area = AT, BE, DE, EE, ES, FR, IE, IT, LT, NL, PT, SI and SK; other AEs = AU, CA, DK, GB, JP, NO, NZ and SE; EMEs = CZ, HU, IL, MX and PL.
Graph 18.A: Statistics across 44 economies showing mean value of real GDP growth for each period of time and each country. Sample covers: AR, AT, AU, BE, BR, CA, CH, CL, CN, CO, CZ, DE, DK, ES, FI, FR, GB, GR, HK, HU, ID, IE, IL, IN, IT, JP, KR, LU, MX, MY, NL, NO, NZ, PE, PH, PL, PT, RO, SE, SG, TH, TR, US and ZA.
Graphs 18.B and 18.C: Labour productivity is defined as gross value added per person employed.
Graph 18.C: The country sample is composed of AT, AU, BE, BR, CA, CH, CL, CO, CZ, DE, DK, ES, FI, FR, GB, GR, HR, HU, ID, IE, IL, IT, JP, KR, LU, MX, NL, NO, NZ, PE, PL, PT, SE, US and ZA. Dots represent country-year pairs. Lines show simple regression and are both statistically significant at the 1/5/10% level.
Graph 19.A: Aggregates showing median and interquartile range over CA, CH, DK, EA, GB, JP, KR, NO, SE and US. Core goods corresponds to goods excluding food and energy.
Graph 19.B: Scenarios show the annual inflation at the end of each year for a number of countries in the euro area. Aggregates show median and interquartile range over AT, BE, DE, ES, FI, FR, IT, NL and PL. Additional price inflation is calculated using the cumulated response of different horizons (in quarters) of producers' price indices in the industrial and services sectors to a 1 percentage point increase in hourly wages. Estimates are based on euro area data from Q1 2009 to Q2 2023; for further details, see Ampudia et al (2024).
References
Acemoglu, D (2024): "The simple macroeconomics of AI", mimeo.
Amatyakul, P, D Igan and M Lombardi (2024): "Sectoral price dynamics in the last mile of post-Covid-19 disinflation", BIS Quarterly Review, March, pp 45–57.
Amiti, M, O Itskhoki and D Weinstein (2024): "What drives U.S. import price inflation?", NBER Working Papers, no 32133, February.
Ampudia, M, M Lombardi and T Renault (2024): "The wage-price pass-through across sectors: evidence from the euro area", BIS Working Papers, no 1192, June.
Andrews, D, C Criscuolo and P Gal (2015): "Frontier firms, technology diffusion and public policy: micro evidence from OECD countries", OECD Productivity Working Papers, no 2, November.
Aramonte, S (2020): "Private credit: recent developments and long-term trends", BIS Quarterly Review, March, pp 11–13.
Aramonte, S and F Avalos (2021): "The rise of private markets", BIS Quarterly Review, December, pp 69–82.
Bank for International Settlements (BIS) (2023): "Navigating the disinflation journey", Annual Economic Report 2023, June, Chapter I, pp 1–39.
Benigno, G, B Hofmann, G Nuno and D Sandri (2024): "Quo vadis, r*? The natural rate of interest after the pandemic", BIS Quarterly Review, March, pp 17–30.
Block, J, Y S Jang, S Kaplan and A Schulze (2024): "A survey of private debt funds", Review of Corporate Finance Studies, vol 13, no 2, pp 335–83.
Borio, C (2014): "The financial cycle and macroeconomics: what have we learnt?", Journal of Banking & Finance, vol 45, pp 182–98.
Borio, C, M Drehmann and D Xia (2019): "Predicting recessions: financial cycle versus term spread", BIS Working Papers, no 818, October.
Borio, C, N Kennedy and S D Prowse (1994): "Exploring aggregate asset price fluctuations across countries: measurement, determinants and monetary policy implications", BIS Papers, no 40, April.
Borio, C, M Lombardi, J Yetman and E Zakrajsek (2023): "The two-regime view of inflation", BIS Papers, no 133, March.
Brynjolfsson, E, D Li and L Raymond (2023): "Generative AI at work", NBER Working Papers, no 31161, April.
Cai, F and S Haque (2024): "Private credit: characteristics and risks", FEDS Notes, February.
Carstens, A (2024): "Trust and macroeconomic stability: a virtuous circle", speech at the Center for Financial Studies, Goethe University, Frankfurt, 18 March.
Committee on the Global Financial System (CGFS) (2023): "Macroprudential policies to mitigate housing market risks", CGFS Papers, no 69, December.
de Soyres, F, D Moore and J Ortiz (2023): "An update on excess savings in selected advanced economies," FEDS Notes, December.
Di Sano, M, G Pongetti, T Schuler and S G Toh (2023): "Spillovers to the euro area from recent negative inflation in China", ECB Economic Bulletin, issue 7, November.
Doornik B, D Igan and E Kharroubi (2023): "Labour markets: what explains the resilience?", BIS Quarterly Review, December, pp 77–93.
Erel, I, T Flanagan and M Weisbach (2024): "Risk-adjusting the returns to private debt funds", NBER Working Papers, no 32278, March.
Farkas, B, U Lewrick, T Stastny and N Tarashev (2023a): "Insurance companies' holdings of sovereign debt", BIS Quarterly Review, March, pp 58–60.
----- (2023b): "Life insurance companies – the missing relief from rising interest rates", BIS Quarterly Review, December, pp 14–16.
Firat, M and O Hao (2023): "Demand vs supply decomposition of inflation: cross-country evidence with applications", IMF Working Papers, no 23/205, October.
Glancy, D and J C Wang (2023): "Lease expirations and CRE property performance", Federal Reserve Bank of Boston Research Department Working Papers, no 23-10, August.
Goldberg, L and J M Campa (2010): "The sensitivity of the CPI to exchange rates: distribution margins, imported inputs, and trade exposure", Review of Economics and Statistics, vol 92, no 2, pp 392–407.
Hardy, B, D Igan and E Kharroubi (2024): "Resilience in emerging markets: what makes it, what could shake it?" BIS Bulletin, no 88, June.
Heise, S, F Karahan and A Şahin (2022): "The missing inflation puzzle: the role of the wage-price pass-through", Journal of Money, Credit and Banking, vol 54, no S1,pp 7–51.
Hilbers, P, Q Lei and L Zacho (2001): "Real estate market developments and financial sector soundness", IMF Working Papers, no 01/129, September.
Hong Kong Monetary Authority (HKMA) (2024): "The financial stability implications of the private credit sector in Asia-Pacific", Research Memorandum, no 05/2024, April.
International Monetary Fund (IMF) (2024a): World Economic Outlook, April.
----- (2024b): Fiscal Monitor: Fiscal policy in the great election year, April.
----- (2024c): "The rise and risks of private credit", Global Financial Stability Report, Chapter 2, April, pp 53–76.
Kirti, D and N Sarin (2024): "What private equity does differently: evidence from life insurance", Review of Financial Studies, vol 37, no 1, pp 201–30.
Miranda-Pinto, J, A Pescatori, E Prifti and G Verduzco-Bustos (2023): "Monetary policy transmission through commodity prices", IMF Working Papers, no 23/215, October.
Mojon, B, P Rungcharoenkitkul and D Xia (forthcoming): "Monetary conditions and monetary policy with large balance sheets", mimeo.
Organisation for Economic Co-operation and Development (OECD) (2023): Economic policy reforms 2023: going for growth.
Shapiro, A (2022): "A simple framework to monitor inflation", Federal Reserve Bank of San Francisco Working Paper Series, no 2020-29, June.
Zhu, H (2002): "The case of the missing commercial real estate cycle", BIS Quarterly Review, September, pp 56–66.