Volatility stirs, markets unshaken
Following a prolonged period of unusual tranquillity, volatility in financial markets ticked upwards in early August. Risk appetite took a dent, as escalating geopolitical tensions added to renewed concerns about the recovery. Equity prices fell, especially in Europe, high-yield credit spreads widened significantly, and yields of safe haven assets such as short-maturity German bunds fell into negative territory. But markets quickly rode out the turbulence. By early September, they had already recovered their losses, as worries over geopolitical tensions gave way to investors' anticipation of further monetary stimulus in the euro area.1
After the spell of volatility in early August, the search for yield - a dominant theme in financial markets since mid-2012 - returned in full force. Volatility fell back to exceptional lows across virtually all asset classes, and risk premia remained compressed. By fostering risk-taking and the search for yield, accommodative monetary policies thus continued to support elevated asset price valuations and exceptionally subdued volatility.
Financial markets reflect shifting macro risks
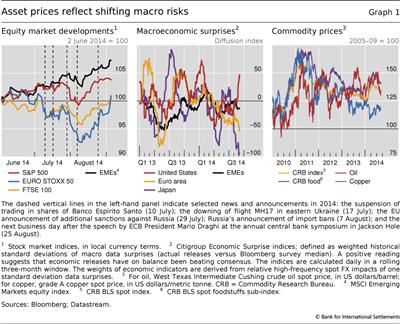
In recent months, shifting risks with respect to the economic recovery in advanced economies proved to be a main factor affecting asset prices. From early July onwards, emerging signs of economic weakness in euro area core countries weighed on markets, and sentiment took another hit as banking sector worries re-emerged in Portugal (Graph 1, left-hand panel). From late July onwards, heightened geopolitical tensions added to these headwinds. In particular, the European Union's announcement of new economic sanctions against Russia on 29 July sparked a sell-off in financial markets. In this spell of market turbulence, global equities retreated, led by a fall on the main European bourses of 5-9% on average. During the market turbulence, US equities held up despite the geopolitical jitters, supported by positive data surprises (Graph 1, centre panel), eg on labour market developments and a strong earnings season by US corporations. Similarly, emerging market economy (EME) equities proved by and large resilient against the market ructions. But high-yield credit markets did experience a hiccup; credit spreads moved up, especially in the lowest-rated market segment (see below).
Increased geopolitical stress had surprisingly little effect on energy markets. In the spot market, oil prices actually fell by around 11% between end-June and early September (Graph 1, right-hand panel). Market expectations for oil demand were revised down, largely on disappointing growth in the euro area and Japan. Incoming data from China were mixed, with that country's manufacturing PMI registering an 18-month high in July, but falling back in August. All in all, demand factors seemingly offset concerns over potential short-run supply disruptions.
The spell of market volatility proved to be short-lived and financial markets resumed their rally soon afterwards. By early September, global equity markets had recouped their losses and credit risk spreads once again consolidated at close to historical lows. While geopolitical worries kept weighing on financial market developments, these were ultimately superseded by the anticipation of further monetary policy accommodation in the euro area, providing support for asset prices.
Diverging economic outlook feeds expectation of asynchronous exit
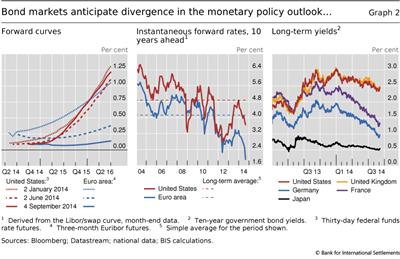
Differences in the strength of the recovery among advanced economies fed expectations of a divergence in monetary policies. Despite additional ECB measures in early June, persistent disinflationary pressures manifested themselves increasingly in a number of gauges of inflation expectations. By the end of August, following remarks by ECB President Mario Draghi at the Jackson Hole conference, market participants started to look for further monetary stimulus, shifting forward rates down (Graph 2, left-hand panel). Additional ECB measures were announced in early September, including interest rate cuts and purchase programmes for asset-backed securities and covered bonds. In response, two-year bond yields moved into negative territory for a number of euro area sovereigns, including - besides Germany - Austria, Belgium, France, Ireland and the Netherlands. These developments contrast with expectations that the US Federal Reserve will embark on a gradual scaling-back of monetary policy accommodation. In line with earlier communications, investors expected the Fed to end its asset purchases by October 2014. Moreover, investors looked for the US policy rate to start rising by mid-2015 and to increase to 125 basis points over the following one-year period. Forward rates pointed to similar expectations for the United Kingdom's policy rate.
Expectations about the path of monetary policy were also reflected in longer-maturity bond prices. Central bank communication that interest rates would be permanently lower in the post-crisis environment has shaped yield curve movements. For example, the instantaneous forward rate 10 years ahead - a gauge for long-term expectations of future short-term rates - dropped well below its 10-year average in both the United States and the euro area (Graph 2, centre panel). This measure contains a term premium in addition to expectations of future short term interest rates. Disentangling the two is difficult, but some commonly used models suggest that the term premium has fallen significantly in 2014, reversing part of the normalisation in the second half of last year. Anticipation of further monetary stimulus helped to nudge long-term euro area benchmark yields to exceptional lows. From mid-August onwards, German 10-year bond yields dropped below 100 basis points for the first time ever (Graph 2, right-hand panel). French, Italian and Spanish bond yields moved in lockstep, keeping intra-euro area sovereign spreads largely unchanged. Surprisingly, in spite of expectations of a first policy rate hike in 2015, yields on UK and US long-term government bonds fell as well. However, the decline was considerably less than in the euro area. As a consequence, US and UK bond spreads widened markedly relative to core euro area benchmark bonds. In early September, the yield on US 10-year bonds stood at 2.4%, respectively 110 and 145 basis points over French and German bond yields, with UK bonds just marginally higher at 2.45%.
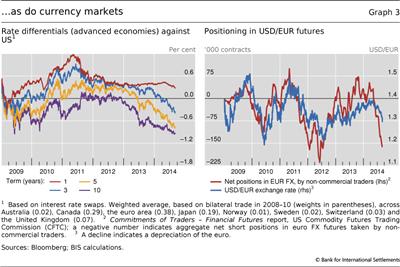
Diverging monetary policies were an increasingly important factor in currency markets too. For a range of advanced economies, interest rate differentials vis-à-vis those of the United States have shrunk considerably or even turned negative since mid-2013 (Graph 3, left-hand panel), dulling the US dollar's appeal as a funding currency. At the same time, low yields on euro-denominated assets for the foreseeable future led investors to revise down their expectations regarding the euro exchange rate. In futures markets, CFTC positioning data confirmed that non-commercial traders (eg speculative investors such as hedge funds) strongly increased the size of their (net) short positions in the euro against the US dollar starting in early May and, once again, from mid-July onwards (Graph 3, right-hand panel). In spot markets, the euro dropped 6.5% against the US dollar between May and early September, helped on its way by the additional monetary stimulus announced by the ECB.
Emerging market economies prove resilient to market jitters
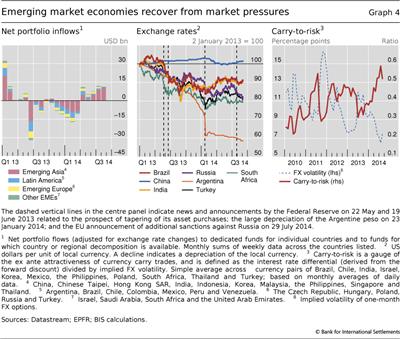
Many emerging market economies benefited from the benign financial conditions during most of the review period, which provided these economies with some relief from the market pressures they had faced in mid-2013 and early 2014.2 Portfolio flows into EMEs recovered across all major regions early in the second quarter, partially reversing the outflows seen in the months before (Graph 4, left-hand panel).
The recovery of many EME asset prices suggests that the search for yield - despite the jitters in late July and early August - remained in full force during the review period. In this environment, 10-year local currency bond yields fell to around 5.8% in late August, some 50 basis points below their level in February 2014. Yields on US dollar-denominated EME sovereign bonds fell by as much as 80 basis points, to 4.8%. At the same time, many EME currencies stabilised (Graph 4, centre panel). Low foreign exchange volatility was an important factor, as it increased the attractiveness of carry trades targeting EME currencies (Graph 4, right-hand panel). In this environment, several central banks in EMEs, including those of Chile, Hungary, Korea, Peru and Turkey, cut policy rates amid weaker activity and lower inflation. By contrast, the central banks of Colombia, Malaysia, Russia and South Africa raised policy rates in the face of macroeconomic or financial stability risks.
The uptick in market volatility in early August had relatively little, and even then only a temporary, impact on most EMEs. There was no broad-based retreat by fund investors, in contrast with the sell-off following the mid-2013 tapering announcement.3 Instead, portfolio flows to Latin America and emerging Europe stagnated, whereas flows into emerging Asia kept up their momentum throughout August. Some repricing of risk took place in EME sovereign and corporate bond markets, but yields remained well below the levels seen earlier in 2014, hovering at close to historical lows. In that context, EME bonds were among the top-performing asset classes in global financial markets in 2014, with US dollar-denominated EME debt registering a total return of almost 10% up to late July, maintaining most of its gain during the early August volatility spell.
However, market participants did not entirely ignore country-specific risks. For example, bond yields in Argentina increased significantly when the country defaulted for technical reasons on its (restructured) debt, even though trading volumes were very low. Similarly, the Russian rouble depreciated by 9% from end-June to early September as investors worried about the escalation of the Ukraine crisis (Graph 4, centre panel). In general, emerging Europe currencies and equities underperformed those of other EME regions, reflecting concerns about the possible effects of geopolitical factors on growth.
High-yield bond markets experience a hiccup
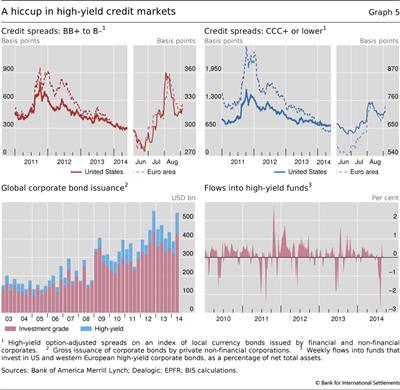
Corporate credit markets experienced a short-lived sell-off during the market jitters from late July to early August, especially in the advanced economies' sub-investment grade segment (Graph 5, top panels). On the back of low volatility and investors' persistent search for yield, high-yield bonds posted spectacular gains from mid-2012. At the same time, investors had absorbed an increasing amount of debt issued by lower-rated corporate borrowers (Graph 5, bottom left-hand panel). Around 35% of the debt issued by European and US corporates in the second quarter of 2014 was rated below investment grade (BB+ or lower). Such a large share of high-yield debt was by no means unprecedented for US corporates; for instance, it was even higher during the run-up to the global financial crisis in 2004-07. But this proportion represented a record high for corporates in the euro area, where market-based finance has traditionally played a subordinate role to bank financing.
With junk bond spreads touching record lows in June (Graph 5, top panels), investors became increasingly wary of high valuations. Thus, the asset class became more vulnerable to sudden shifts in sentiment. High-yield spreads had already ticked up by around 40 basis points between mid-June and mid-July. And, when risk appetite waned in late July and early August, the sell-off in junk bond markets accelerated. Selling pressure in secondary markets probably originated from retail investors redeeming a record amount of almost $20 billion from mutual funds dedicated to the asset class between early July and early August. When expressed as a share of net asset values, this outflow exceeds for instance the outflows from the asset class during the mid-2013 turmoil (Graph 5, bottom right-hand panel). From 29 July to 8 August, the bond spreads of US and European corporates in the lowest-rated high-yield segment (CCC+ and lower) spiked by around 70 basis points and 130 basis points, respectively. Junk bonds with better ratings (BB+ to B-) were less affected, rising only a respective 35 basis points and 48 basis points for US and European borrowers (Graph 5, top left-hand panel). The brief spike in high-yield spreads soon abated when institutional investors took the surge in spreads as a buying opportunity, as indicated by market commentary. By mid-August, markets had stabilised and spreads started to shrink again. The search for yield and accommodative global funding conditions were still very much in place at the end of the review period.
Volatility stirs, but reverts to lows
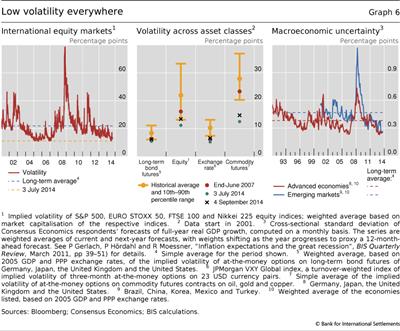
The short-lived turbulence in late July followed a prolonged period of calm in financial markets, during which volatility was extraordinarily subdued in all major asset classes (Graph 6, left-hand and centre panels). By early July 2014, the implied (forward-looking) volatility of bonds, equities, exchange rates and commodity prices (green dots in Graph 6, centre panel) had fallen well below historical averages (yellow dots), and in several cases even below pre-crisis levels (red dots).
The geopolitical tensions in late July triggered a temporary rise in volatility. The VIX nudged up to 17% in early August, about 7 percentage points higher than a month before. However, this short-lived pickup in volatility pales in comparison with the levels seen in the 1987 crash, the 2001 dotcom bubble burst, the 2007-09 financial crisis or the deepening of the European sovereign debt crisis in 2011.4 And by late August, the VIX had already dropped back to 12% as investor risk appetite recovered and equity markets (in particular in the United States) resumed their rally. Volatility in other asset classes also fell back to the low levels seen in early July (black crosses in Graph 6, centre panel).
The current low level of volatility can be partly attributed to reduced macroeconomic uncertainty. Volatility is generally lower during business cycle expansions than in recessions, when uncertainty about macroeconomic and firm-specific fundamentals tends to be higher.5 In fact, macroeconomic uncertainty has dropped significantly since the euro area sovereign debt crisis abated in mid-2012. At the same time, market participants' growth expectations have become much less dispersed, not only in advanced economies but also in major EMEs (Graph 6, right-hand panel). Greater macroeconomic stability gives rise to fewer surprises (eg regarding earnings or creditworthiness) and thus less need for portfolio rebalancing and trading. This, in turn, reduces the volatility of actual asset price movements.
The exceptionally accommodative monetary policy of recent years is also likely to have played a key role in driving volatility to such exceptional lows. Policy has had a direct effect, by compressing volatility in fixed income markets. For example, the reduction of interest rates to the effective lower bound in all major currency areas has pinched down the amplitude of interest rate movements at the short end of the yield curve. More transparent central bank communication, forward guidance and asset purchases have also removed uncertainty about interest rate changes for medium- and longer-term maturities.
By fostering the search for yield and influencing risk appetite in the market, accommodative policies have also had an indirect effect on volatility.6 An environment of low yields on high-quality benchmark bonds - coupled with investor confidence in the continuation of favourable market conditions - is set to foster risk-taking behaviour. This then tends to be reflected in lower hedging costs via options, as well as a general narrowing of risk premia. In fact, the decline in volatility across asset classes since mid-2012 has gone hand in hand with rising asset valuations and collateral values more generally. As the capital constraints faced by financial intermediaries are alleviated, these institutions have an incentive to take on more risk, sending asset prices higher. This potentially creates additional feedback effects, since return volatility tends to be dampened when valuations rise (see box). As market participants further revise down their perceptions of (market) risk, they may be inclined to take larger positions in risky assets, boosting prices and pushing volatility even lower.
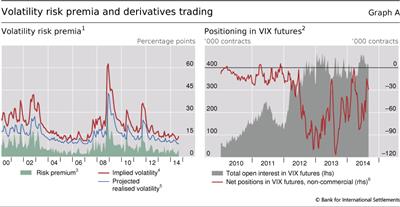
There are also signs that investor confidence in the continuation of low volatility and ample funding at low rates has encouraged market participants to take increasingly speculative positions on volatility in derivatives markets. The popularity of such leverage-like investment strategies can be gauged from open interest in exchange-traded volatility derivatives (see Graph A, right-hand panel, and discussion in box). CFTC positioning data indicate further that speculative (non-commercial) traders have significant overall net short positions in VIX futures, a sign of their continued willingness to sell insurance to other investors against rising volatility, despite a fairly narrow volatility risk premium.
Volatility concepts and the risk premium
Marco Lombardi and Andreas Schrimpf
Financial volatility is a measure of the variability of asset prices (or asset returns) over time. As it is a multifaceted concept, several different volatility measures are used in practice. These fall into two broad categories: statistical volatility (ie the volatility of the actual return distribution) and implied volatility (ie the volatility of the returns implied in option prices).
Statistical measures of volatility are based on observed asset returns over a given time interval. This can be done in various ways. A simple, model-free approach is to compute the standard deviation of the actual returns on a given asset over a particular time window, so-called realised (or "historical") volatility. Model-based approaches have also been proposed: ARCH (autoregressive conditional heteroscedasticity) models, for example, assume that the variance of returns fluctuates over time according to a specific time series model.
Implied volatility, by contrast, is derived using option prices. It thus embeds information about market participants' expectations of future movements in the price of the underlying asset as well as their appetite for holding that risk. The best known example is the volatility index (VIX), a model-free measure of implied volatility on the S&P 500. The VIX is constructed using option premia from a wide array of calls and puts, with a maturity of 30 days and a broad range of strike prices.
By comparing measures of implied and statistical volatility, researchers and practitioners can infer the volatility risk premium. This premium can be thought of as the compensation demanded by investors for bearing risk related to sharp changes in market volatility. To isolate this premium, researchers often compare implied volatility (eg measured by the VIX) with a projection of realised volatility over the same horizon. For instance, Bekaert et al (2013; see Graph A, footnote 3) propose a simple approach to estimate expected realised volatility over a one-month horizon, and suggest that the difference between implied and projected realised volatility can be interpreted as a proxy for investors' attitude towards risk. The red and blue lines in the left-hand panel of Graph A depict, respectively, the implied and projected realised volatility, and the green shaded area corresponds to the gauge of time-varying risk aversion. When volatility spikes in stress episodes, investors' attitude towards risk usually follows, as investors are less willing to hold positions in risky assets or to provide insurance against sharp asset price changes. More interestingly, estimates of the volatility risk premium have dropped quite substantially since mid-2012, and now stand at close to pre-crisis levels.
A well known empirical regularity is that volatility tends to be negatively correlated with current and past asset returns. In other words, volatility tends to be much higher when asset prices drop than when markets rally. The traditional interpretation of this asymmetric relationship is the so-called leverage effect. According to this explanation, a fall in equity prices would generally imply a rise in firms' leverage, and in turn raise the riskiness of a given stock. An alternative explanation relates the negative correlation to changes in attitudes towards risk: since low volatility is associated with increased willingness to take on risk, a low-volatility environment is likely to be accompanied by rising asset valuations.
Recent economic theory emphasises the endogenous nature of volatility. A prolonged period of low volatility could paradoxically lead to a build-up in risk.
 One key mechanism relates to the effect of changes in volatility on measures such as value-at risk (VaR) or Sharpe ratios, extensively used to inform risk-taking and risk management by financial intermediaries. For a given VaR threshold, lower volatility increases the fraction of the portfolio that a financial institution can hold in risky assets. Similarly, for a given portfolio composition and amount of capital, lower volatility can also encourage the build-up of leverage to finance a larger asset portfolio. A second potential source for a build-up in risk in a low-volatility environment is crowded investment behaviour by asset managers and similar types of non-bank players.
 Expectations of the continuation of benign financial conditions and low volatility may encourage these market participants to build up large positions in riskier asset classes, which further compresses risk premia.
There are also signs of intensified speculative activity on volatility. As shown in Graph A, the size of net short positions on VIX futures held by non-commercial traders (eg hedge funds) - ie bets that volatility is going to stay low - has been increasing sharply on the back of low volatility since mid-2012. The graph also suggests that traders were quick to scale back such short positions during the taper tantrum episode in mid-2013, during the market turbulence of early 2014, and most recently during the market hiccup of late July to early August 2014.
 If one has access to high-frequency financial data (eg five-minute returns), realised volatility has been shown to be a highly accurate estimator of the diffusion component of the stochastic process driving the evolution of the price of the asset (Anderson et al (2003), op cit).
  The pricing of options is based on the principle of no arbitrage. To make this operational, the evolution of the asset on which the option is written has to be cast in a "risk-neutral" framework, in which the transition probabilities governing the evolution of the price of the underlying asset are adjusted for investors' attitude towards risk. In this sense, these "risk-neutral" probabilities differ from the "physical" probabilities governing the evolution of observed returns on the underlying asset.
  See R Engle, "Autoregressive conditional heteroscedasticity with estimates of the variance of United Kingdom inflation", Econometrica, vol 50, 1982, pp 987-1007.
  Recent work also stresses the possibility that implied volatility may partly reflect the risk-bearing capacity of dealers acting as intermediaries in option markets (eg N Gârleanu, L Pedersen and A Poteshman, "Demand-based option pricing", Review of Financial Studies, vol 22, 2009, pp 4259-99).
  Some market participants use the term "risk appetite" to characterise investors' attitudes towards risk. The term "risk aversion" is more technical, and is related by some to innate agents' preferences.
  See F Black, "Studies of stock price volatility changes", Proceedings of the 1976 Meetings of the American Statistical Association, Business and Economic Statistics Section, 1976, pp 177-81.
  This interpretation of the observed negative correlation between volatility and asset returns was first put forth by R Pindyck, "Risk, inflation and the stock market", American Economic Review, vol 74, 1984, pp 335-51.
  See eg H S Shin, Risk and liquidity, Oxford University Press, 2010; and T Adrian and N Boyarchenko, "Intermediary leverage cycles and financial stability", Federal Reserve Bank of New York, Staff Reports, no 576, August 2012.
  This has been labelled, inter alia, the "financial instability paradox" or also "volatility paradox"; see C Borio and M Drehmann, "Towards an operational framework for financial stability: 'fuzzy' measurement and its consequences", BIS Working Papers, no 284, June 2009; and M Brunnermeier and Y Sannikov, "A macroeconomic model with a financial sector", American Economic Review, vol 104, no 2, 2014.
  See K Miyajima and I Shim, "Asset managers in emerging market economies", BIS Quarterly Review, September 2014, pp 19-34.
1 This article was prepared by the BIS Monetary and Economic Department. Questions about the article can be addressed to Christiaan Pattipeilohy (christiaan.pattipeilohy@bis.org) and Andreas Schrimpf (andreas.schrimpf@bis.org). Questions about data and graphs should be addressed to Alan Villegas (alan.villegas@bis.org).
2 EME corporates and sovereigns have issued record amounts of local and foreign currency-denominated debt securities in recent years (see B Gruić, M Hattori and H S Shin, "Recent changes in global credit intermediation and potential risks", BIS Quarterly Review, September 2014, pp 17-18), which makes these borrowers potentially vulnerable to deteriorating global funding conditions and sharp exchange rate movements. See M Chui, I Fender and V Sushko, "Risks related to EME corporate balance sheets: the role of leverage and currency mismatch", BIS Quarterly Review, September 2014, pp 35-47).
3 Bank lending to EMEs also slowed significantly in mid-2013, particularly for borrowers in countries with high current account deficits or a large share of US dollar-denominated bank liabilities (see S Avdjiev and E Takáts, "Cross-border bank lending during the taper tantrum: the role of emerging market fundamentals", BIS Quarterly Review, September 2014, pp 49-60).
4 Financial volatility (see the box for a discussion of various volatility concepts) is typically persistent, but also tends to revert to its mean over longer horizons. Bursts of volatility linked to specific events generally last up to several months, but also herald extended periods of relative calm. This volatility clustering effect becomes particularly apparent when taking a long-term perspective.
5 In this regard, the current phase is akin to the two prior prolonged low-volatility episodes of 1993-2000 and 2004-07, which coincided with post-recession recoveries.
6 The response of financial intermediaries to accommodative monetary conditions - taking greater risk - is known as the risk-taking channel of monetary policy. See BIS, 84th Annual Report, Chapter II, June 2014, for a discussion of this monetary transmission channel.

